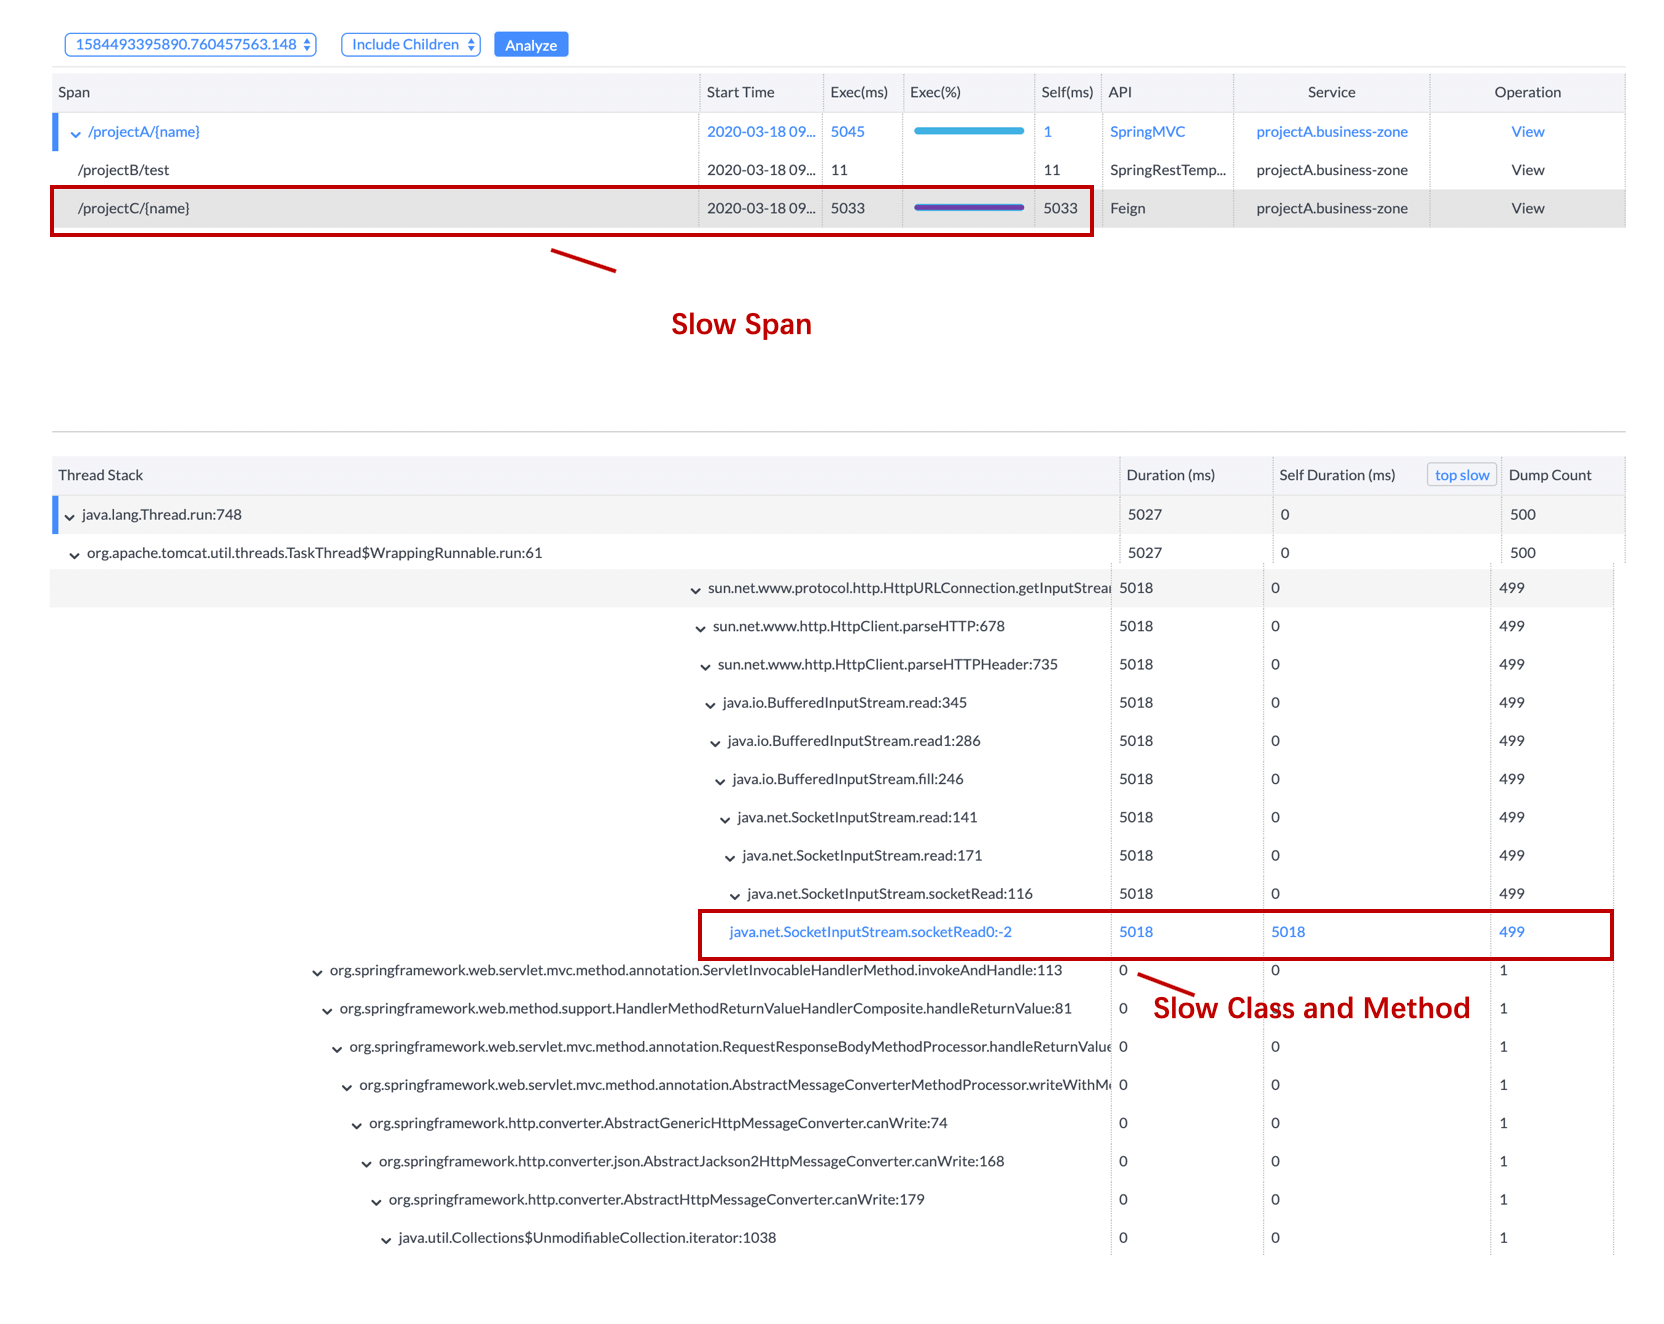
Security Reviewer suite provides an Application Performance Monitoriing solution named Dynamic Reviewer APM.
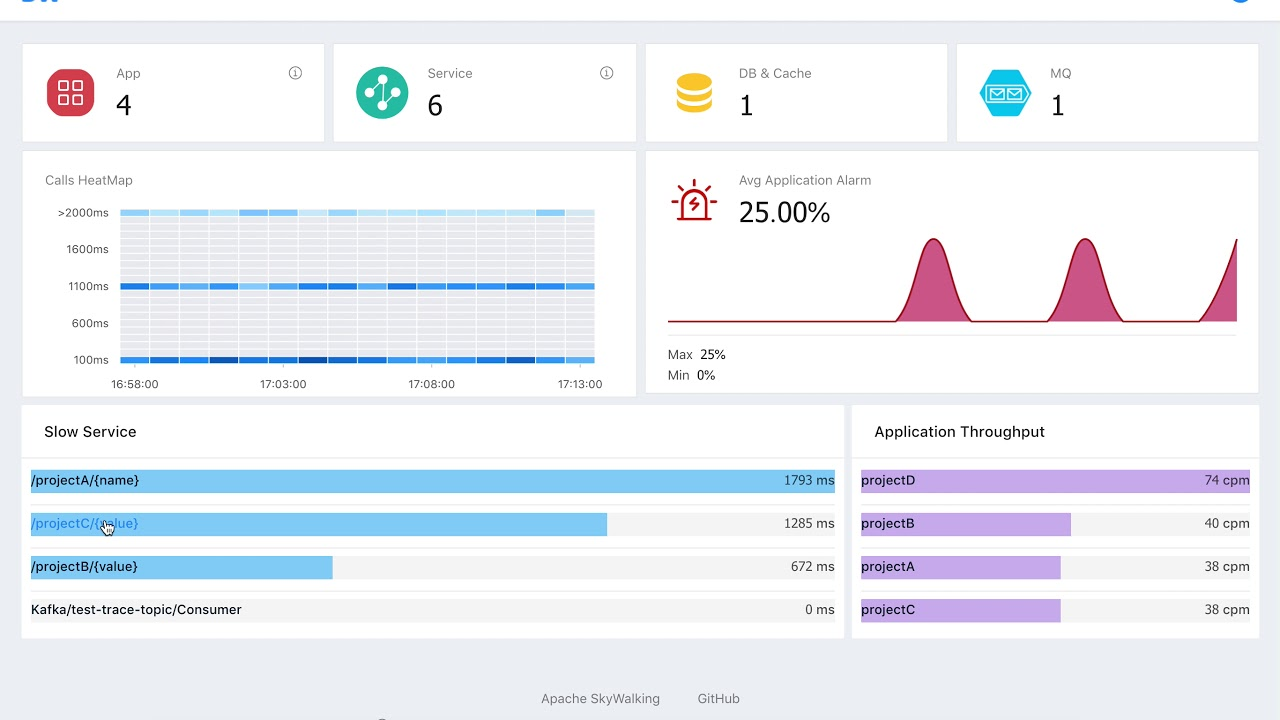
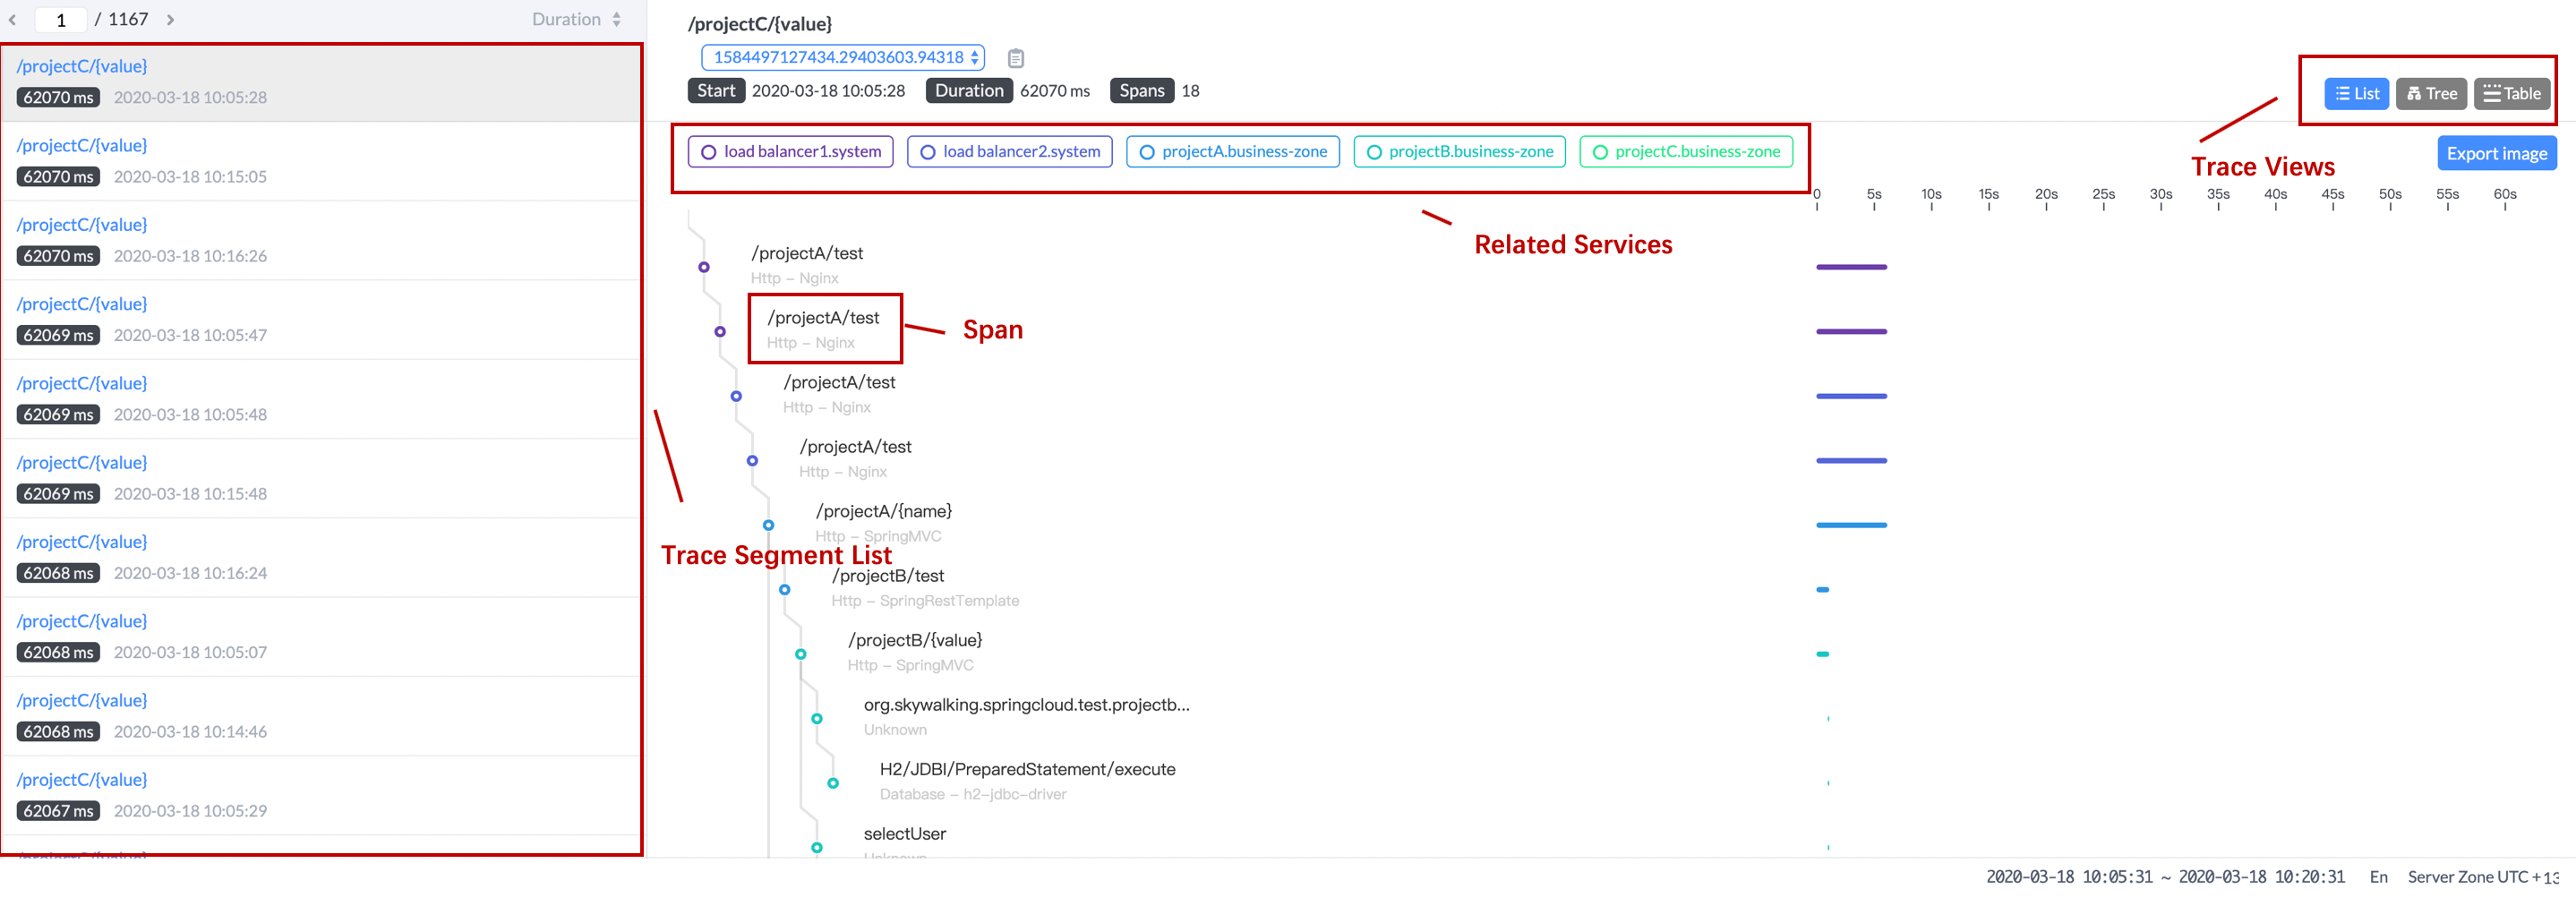
APM is an additional module of Dynamic Reviewer (to be purchased separately) providing software monitoring services and applications in real time — collect detailed performance information on response time for incoming requests, database queries, calls to caches, external HTTP requests, and more. This makes it easy to pinpoint and fix performance problems quickly.
APM is based on Apache SkyWalking tecnhology and requires maximum 3% of 1 core CPU, and It is offered as a SkyWalking 3rd-party instrument library.
Respect than SkyWalking, it adds a number of languages metrics, new kind of distributed Agents and integration with Security Reviewer Suite. Further SkyWalking original code has been secured after a Static Reviewer analysis.
In multi-language, continuously deployed environments, cloud native infrastructures grow more powerful but also more complex. APM’s service mesh receiver allows APM to receive telemetry data from service mesh frameworks such as Istio/Envoy and Linkerd, allowing users to understand the entire distributed system.
APM provides observability capabilities for service(s), service instance(s), endpoint(s). The terms Service, Instance and Endpoint are used everywhere today, so it is worth defining their specific meanings in the context of APM/SkyWalking:
Service. Represents a set/group of workloads which provide the same behaviours for incoming requests. You can define the service name when you are using instrument agents or SDKs. APM can also use the name you define in platforms such as Istio.
Service Instance. Each individual workload in the Service group is known as an instance. Like pods in Kubernetes, it doesn’t need to be a single OS process, however, if you are using instrument agents, an instance is actually a real OS process.
Endpoint. A path in a service for incoming requests, such as an HTTP URI path or a gRPC service class + method signature.
APM/SkyWalking allows users to understand the topology relationship between Services and Endpoints, to view the metrics of every Service/Service Instance/Endpoint and to set alarm rules.
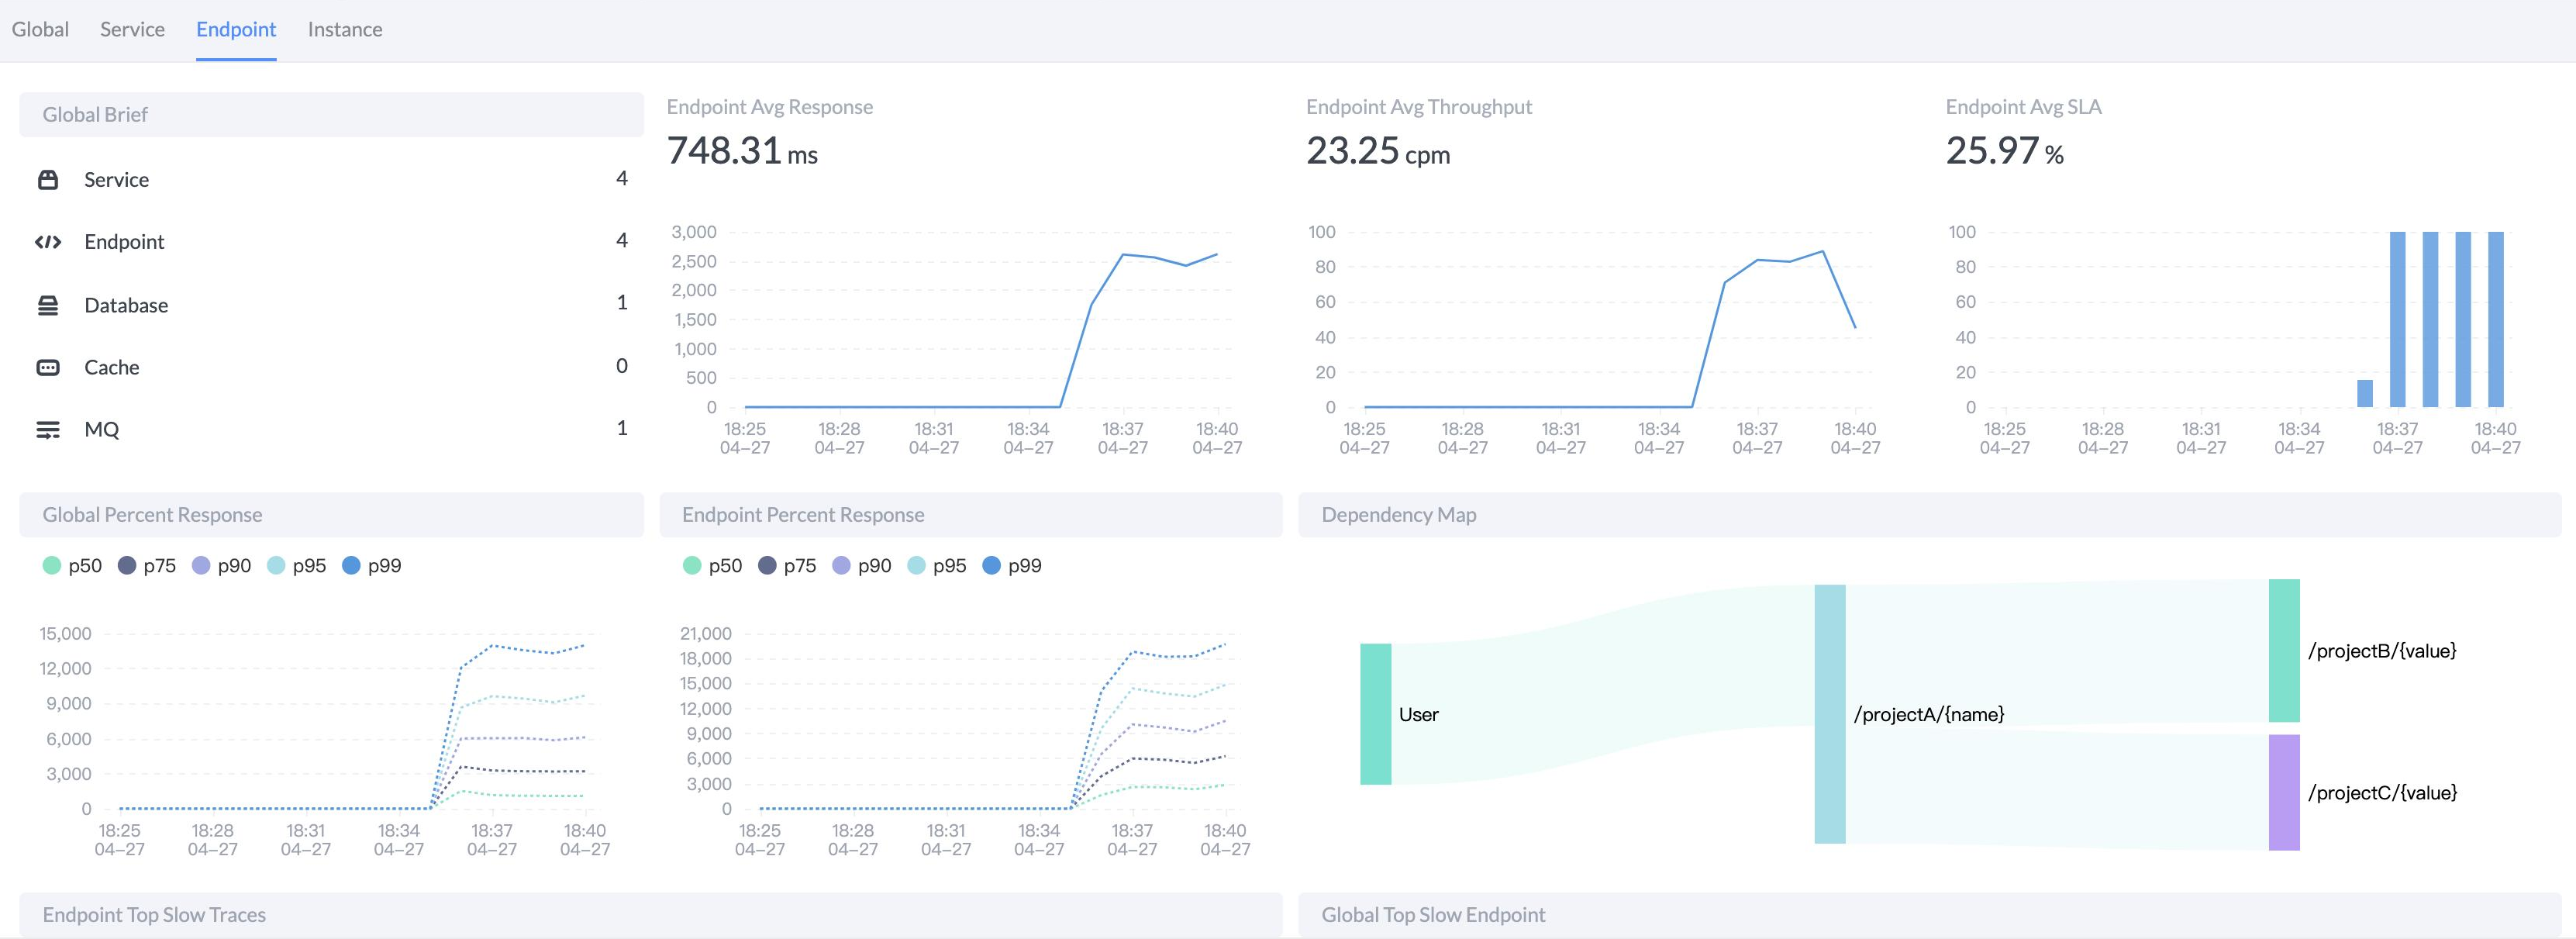
APM/SkyWalking introduces the new core concept Layer. A layer represents an abstract framework in computer science, such as Operating System(OS_LINUX layer), Kubernetes(k8s layer). All detected instances belong to a layer to represent the running environment of this instance, the service would have one or multiple layer definitions according to its instances.
In addition, you can integrate
Other distributed tracing using APM/SkyWalking native agents and SDKs with Zipkin, Jaeger and OpenCensus.
Other metrics systems, such as Prometheus, Sleuth(Micrometer), OpenTelemetry.
APM is built for consistent observability. Monitor everything happening to your application in browser.
Service mesh observability built-in. Collect and analyze data from Istio + Envoy Service Mesh.
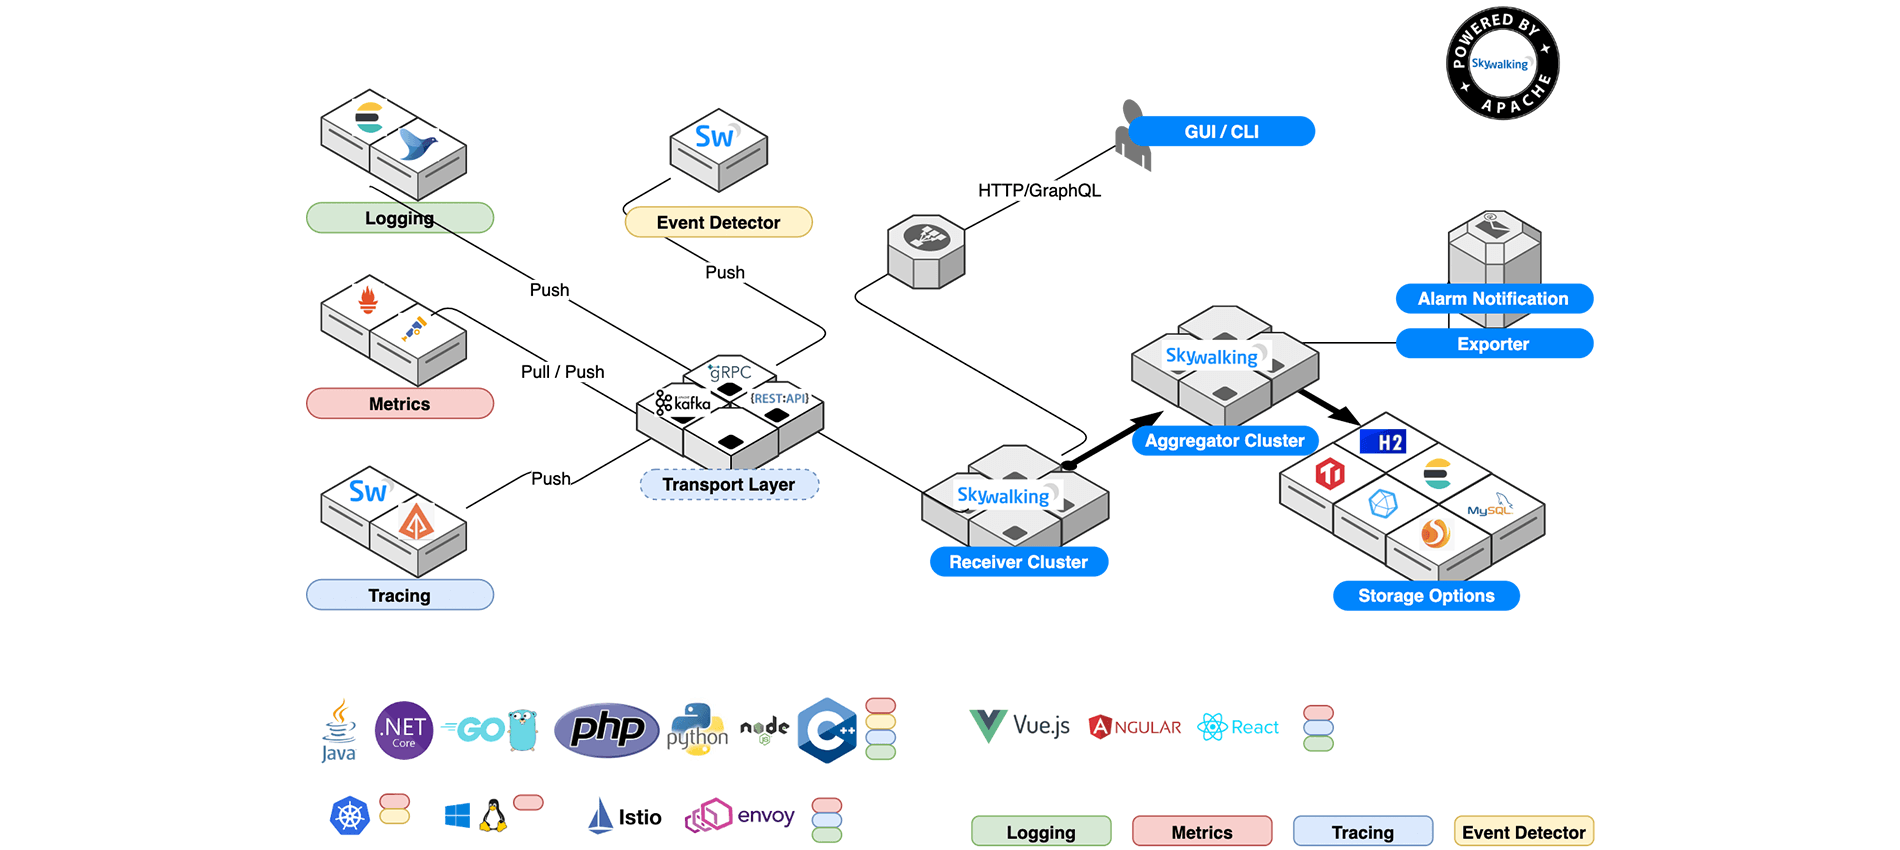
Probes collect data and reformat them for APM requirements (different probes support different sources).
Platform backend supports data aggregation, analysis and streaming process covers traces, metrics, and logs.
Storage houses APM data through an open/plugable interface. You can choose your own existing implementation, such as ElasticSearch, H2, MySQL, TiDB, InfluxDB, or implement your own. Patches for new storage implementors welcome!
UI is a highly customizable web based interface allowing APM end users to visualize and manage APM data.
Dynamic Reviewer's APM also automatically collects unhandled errors and exceptions. Errors are grouped based primarily on the stackTrace, so you can identify new errors as they appear and keep an eye on how many times specific errors happen.
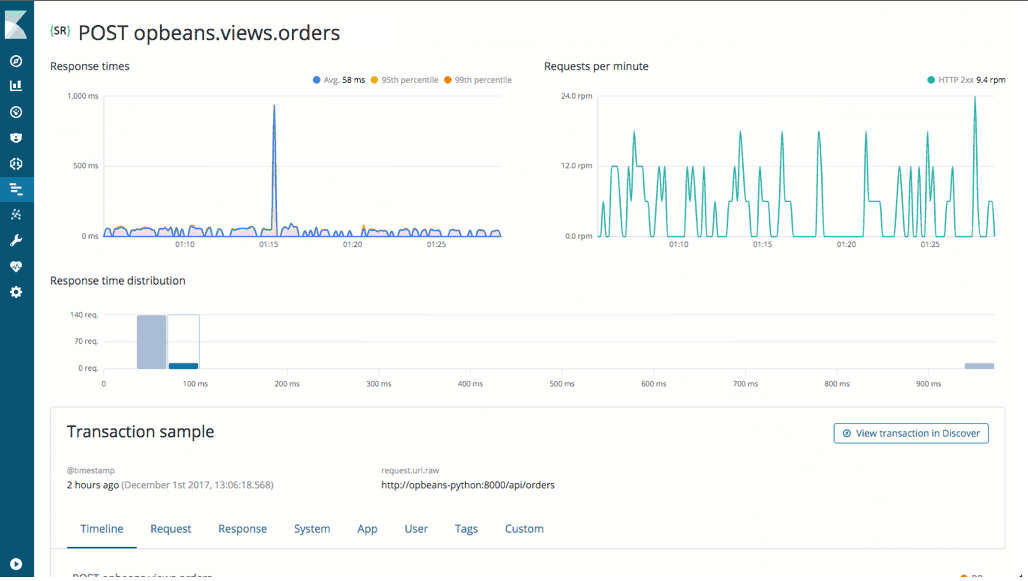
Metrics are another important source of information when debugging production systems. APM agents automatically pick up basic host-level metrics and agent specific metrics, like Node.js, Vue.js, React, Angular, Python, Ruby, PHP, Java, Scala, Kotlin, Clojure, C/C++, GO, .NET, .NET Core, ASP.NET Core, LUA, Rust.

No big data stack. Adopt to different scale by configuring which modules to include.
Built-in webhooks support for automatically sending out event notifications via HTTP, gRPC, Slack, and more.
Alarm Rules are constituted by following keys
Rule name. Unique name, show in alarm message. Must end with _rule.
Metrics name. A.K.A. metrics name in oal script. Only long, double, int types are supported.
Include names. The following entity names are included in this rule.
Exclude names. The following entity names are excluded in this rule.
Include names regex. Provide a regex to include the entity names. If both setting the include name list and include name regex, both rules will take effect.
Exclude names regex. Provide a regex to exclude the entity names. If both setting the exclude name list and exclude name regex, both rules will take effect.
Include labels. The following labels of the metric are included in this rule.
Exclude labels. The following labels of the metric are excluded in this rule.
Include labels regex. Provide a regex to include labels. If both setting the include label list and include label regex, both rules will take effect.
Exclude labels regex. Provide a regex to exclude labels. If both setting the exclude label list and exclude label regex, both rules will take effect.
The settings of labels is required by meter-system which intends to store metrics from label-system platform, just like Prometheus, Micrometer, etc. The function supports the above four settings should implement LabeledValueHolder.
Threshold. The target value. For multiple values metrics, such as percentile, the threshold is an array. Described like value1, value2, value3, value4, value5. Each value could the threshold for each value of the metrics. Set the value to - if don’t want to trigger alarm by this or some of the values.
Such as in percentile, value1 is threshold of P50, and -, -, value3, value4, value5 means, there is no threshold for P50 and P75 in percentile alarm rule.
OP. Operator, support >, >=, <, <=, =. Welcome to contribute all OPs.
Period. How long should the alarm rule should be checked. This is a time window, which goes with the backend deployment env time.
Count. In the period window, if the number of values over threshold(by OP), reaches count, alarm should send.
Only as condition. Specify if the rule can send notification or just as an condition of composite rule.
Silence period. After alarm is triggered in Time-N, then keep silence in the TN -> TN + period. By default, it is as same as Period, which means in a period, same alarm(same ID in same metrics name) will be trigger once.
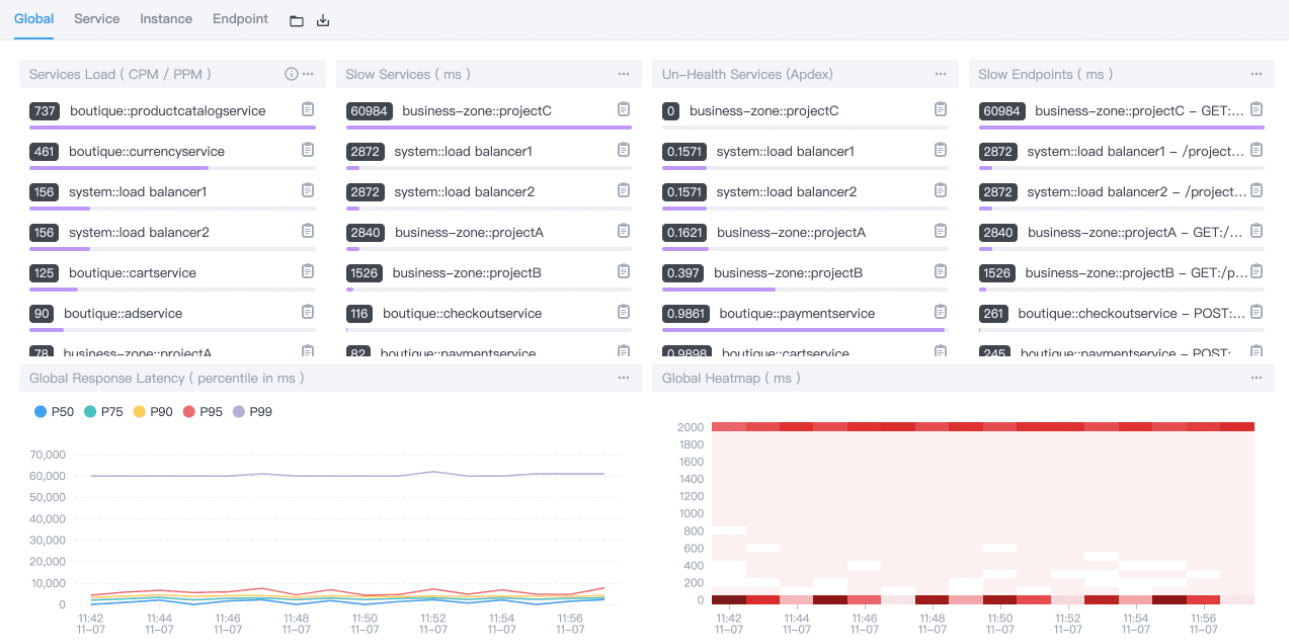
Built-in data visualization that gets your team started. Your can further customize it or integrate your own.
APM supports a wide range of backend storage solutions, and they are pluggable.
APM agents provide little extra load for target services.
