All you need is Quality
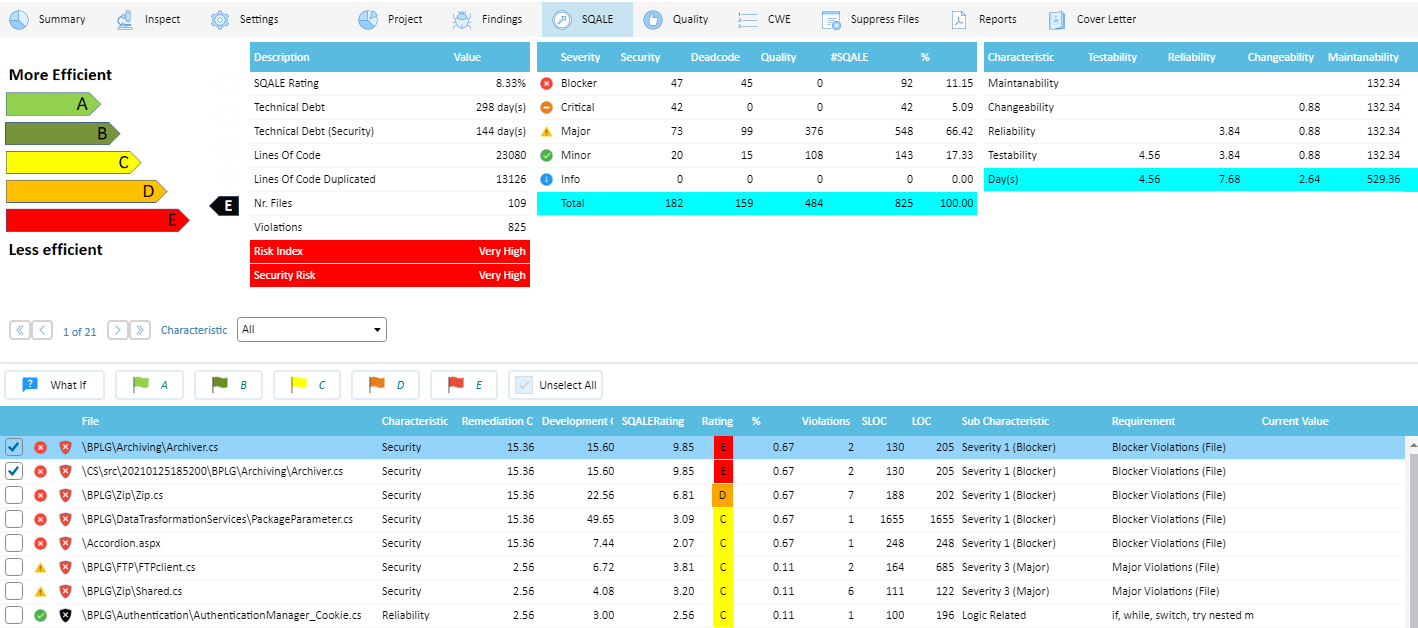
Quality Reviewer evaluates regressions and understands changes in the source code using automated Software Metrics visualization (SW complexity, size and structure Metrics, Halstead Metrics, ISO 9126 maintainability, ISO 25010, Chidamber & Kemerer, SQALE), as well as Effort Estimation (APPW, AFP, QSM FP, SRM FP, COSMIC, COCOMO, Revic) and reporting features. It helps to keep code entropy under control, be it in house development or outsourced maintenance projects.
Quality Reviewer is part of Security Reviewer Suite.
The information collected, analysed and visualised with the SQALE methodology is easily comprehended and offers an incomparable insight into your software development. That facilitates the communication at all levels, from the IT directors to the developers and vice versa.
How can a technical manager communicate the positive effects of his or her work if the software quality remains largely invisible? How can budgeting departments, decision makers and internal customers be convinced of the necessity of the quality and productivity enhancing measures or the complexity of a particular work request?
Quality Reviewer makes a significant contribution in this area. SQALE enhanced reporting feature provide an overview of your entire software landscape which even non-technical individuals can understand easily. Managers and decision makers can see evidence of the quality of the system and the productivity increases achieved and can therefore be more easily convinced of measures such as software quality assurance. In reverse, developers and team leaders can show managers and directors what they have achieved.
Static Confidence Factor
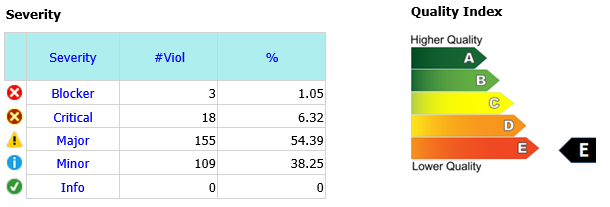
The Static Confidence Factor is a measurement standard combining the most important Quality Analysis results in a single value. It is calculated by collecting 20 Quality Metrics and 20 Anti-Patterns, classified in 5 Severity Levels. The lower is the Static Confidence Factor, the higher is the Application Quality. From Static Confidence Factor derives the Quality Index, both provided by Quality Reviewer. Example of Quality Index:
Each Severity has a different weight, named Defect Probability (DP). It is based on two decades of field experience, about correlation between code Quality and Defects in production.
The Violations (V) mean out-of-range Metrics as well as the number of Anti-Patterns found in the analyzed code, grouped in Static Defect Count (SDC).
For each Severity:
SDC(severity) = (V(severity)/NViol) * DP(severity)
where: V is the # of Violations per severity, and DP is the Defect Probability per severity
NViol= Total # of Violations
The Static Confidence Factor (SCF) is calculated:
SCF = (SDC(Blocker)+4)+(SDC(Critical)+2)+(SDC(Major)+2)+(SDC(Minor)+1)+(SDC(Info)+1)
Where: SDC is the Static Defect Count per severity.
Application Architecture
The Application Architecture gives you a roadmap and best practices to follow when building an application, so that you end up with a well-structured app. Quality Reviewer is able to create a Design Structure Matrix (DSM) and a Call Graph, by reading the source code and/or related UML diagrams.
DSM-Design Structure Matrix
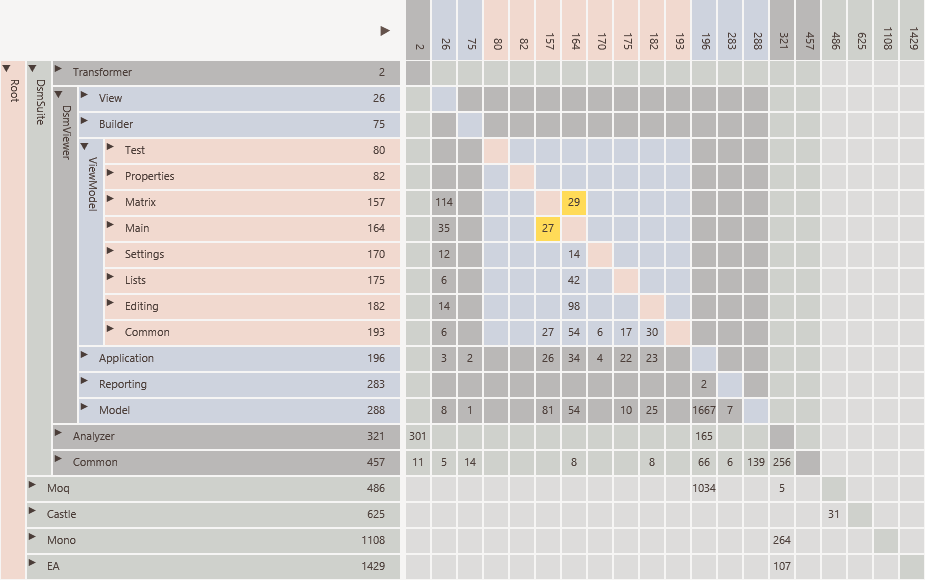
An example of Quality Reviewer’s automatically generated Design Structure Matrix is shown below:
A Design Structure Matrix consists of a matrix to visualize Dependencies of hierarchically organized elements and a set of algorithms which can be applied on the matrix to sort the elements in order to discover layering.
A Design Structure Matrix (DSM) is made by two parts
A matrix to visualize dependencies
Algorithms which can be applied on the matrix to discover e.g. layering in the software.
The DSM consists of a matrix with the same elements in the rows and columns
The hierarchy of packages and elements is visible on the left.
The relations between the elements are shown in the cells.
In a DSM, the hierarchy can also be folded in whole or in part. The relational strengths of the collapsed cells are simply combined. As a result, the DSM will become more compact, but will still remain correct in terms of content.
In this way it is possible to display a system with thousands of elements and still keep the overview.
DSM Architectural Discovery
By applying a partitioning algorithm on the DSM, the layering of the software will be discovered by Quality Reviewer during the Static Analysys. Such an algorithm tries to reorder the DSM in such a way that as many relationships as possible come under the diagonal.
After partioning elements with many inbound relationships (providers) have shifted to the bottom, while the elements with many outgoing relationships (consumers) have shifted to the top.
Cyclic relations can be easily spotted, because the type of relations remain above the diagonal.
DSM Assist in refactoring
A DSM can be used to improve the dependency structure. One can think of:
Removing cyclic dependencies.
Improving the cohesiveness of a component by move elements to other component were the have stronger relations.
In the matrix we can move an element to another component or layer, combine it with other elements or split and then recalculate all dependencies to see if this yields a better dependency structure.
After recalculating the dependencies it can be seen that the cyclical relationship between the presentation and application layer has disappeared.
The advantages of such an impact analysis are particularly evident in improvement scenarios that take place at the architectural level and thus affect multiple components. Without the use of a DSM, such analysis are unreliable, because the intended and the actual software architecture often do not match.
DSM-Supported Languages
.NET: C# and vb.NET Assembly
JAVA, Clojure, Groovy, Kotlin JAR files
C/C++ Source and Header files
UML in Sparx System Enterprise Architect format
DSI Model. Two DSI model files can be compared
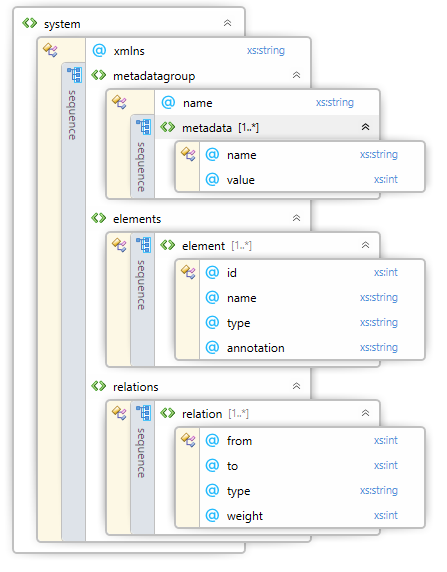
A DSI file represent an analyzer’s output. Each code analyzer must export its DSM results to DSI file. To ensure that the Quality Reviewer can import this file, it must conform the DSI file XSD schema below:
DSI file is a way to import 3rd-party analyzer’s DSM output to Quality Reviewer.
Call Graph
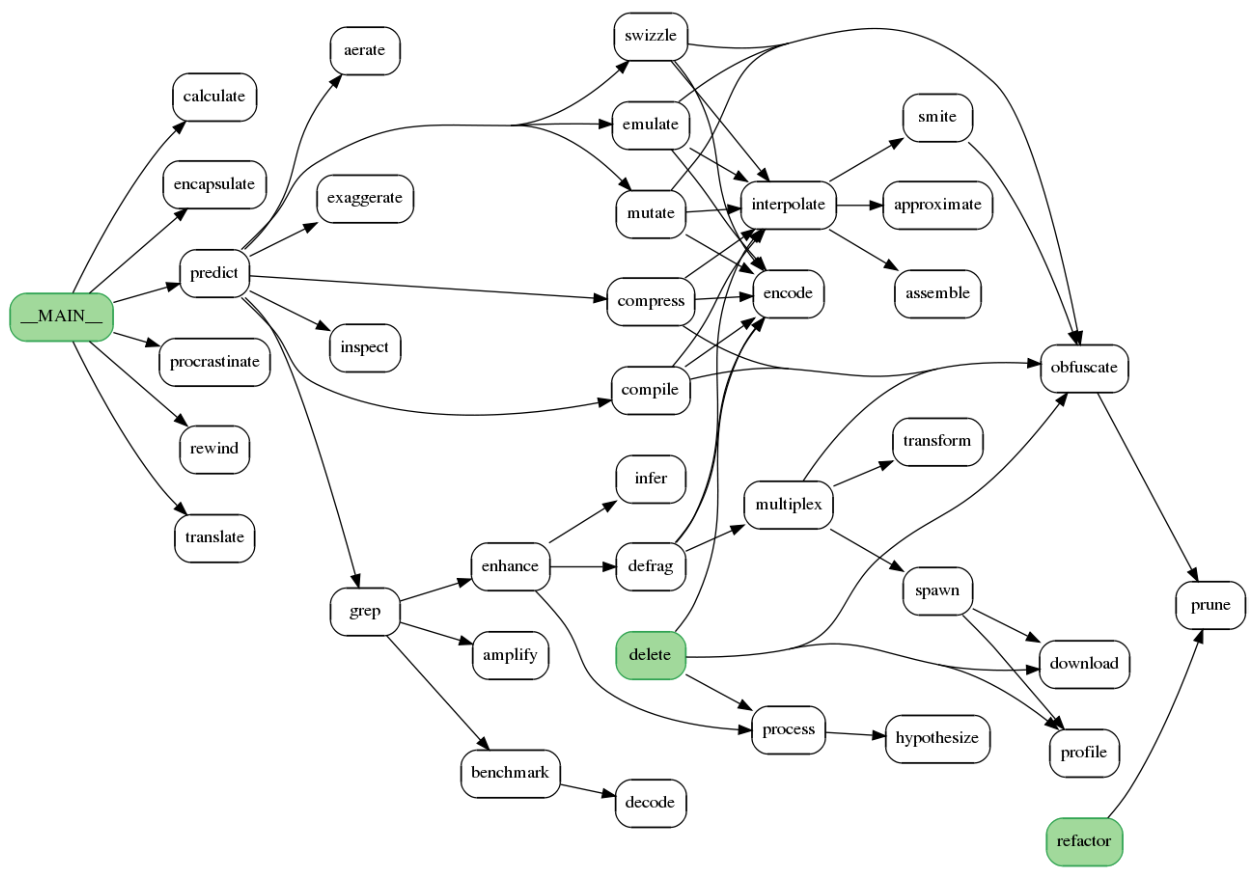
Starting from source code, a Call Graph is automatically generated by Quality Reviewer showing how classes and functions call each other within an application:
Each oval represents a function. Each arrow indicates a function call. In the diagram above, the main program is represented by node MAIN.
It calls 6 functions, one of which calls 9 other functions.
It parses source code for function definitions and calls, generates a call graph image, and displays it on screen.
Supported languages for Call Graph are:
bash, go, lua, javascript, typescript, julia, kotlin, perl, php, python, R, ruby, rust, scala, swift.
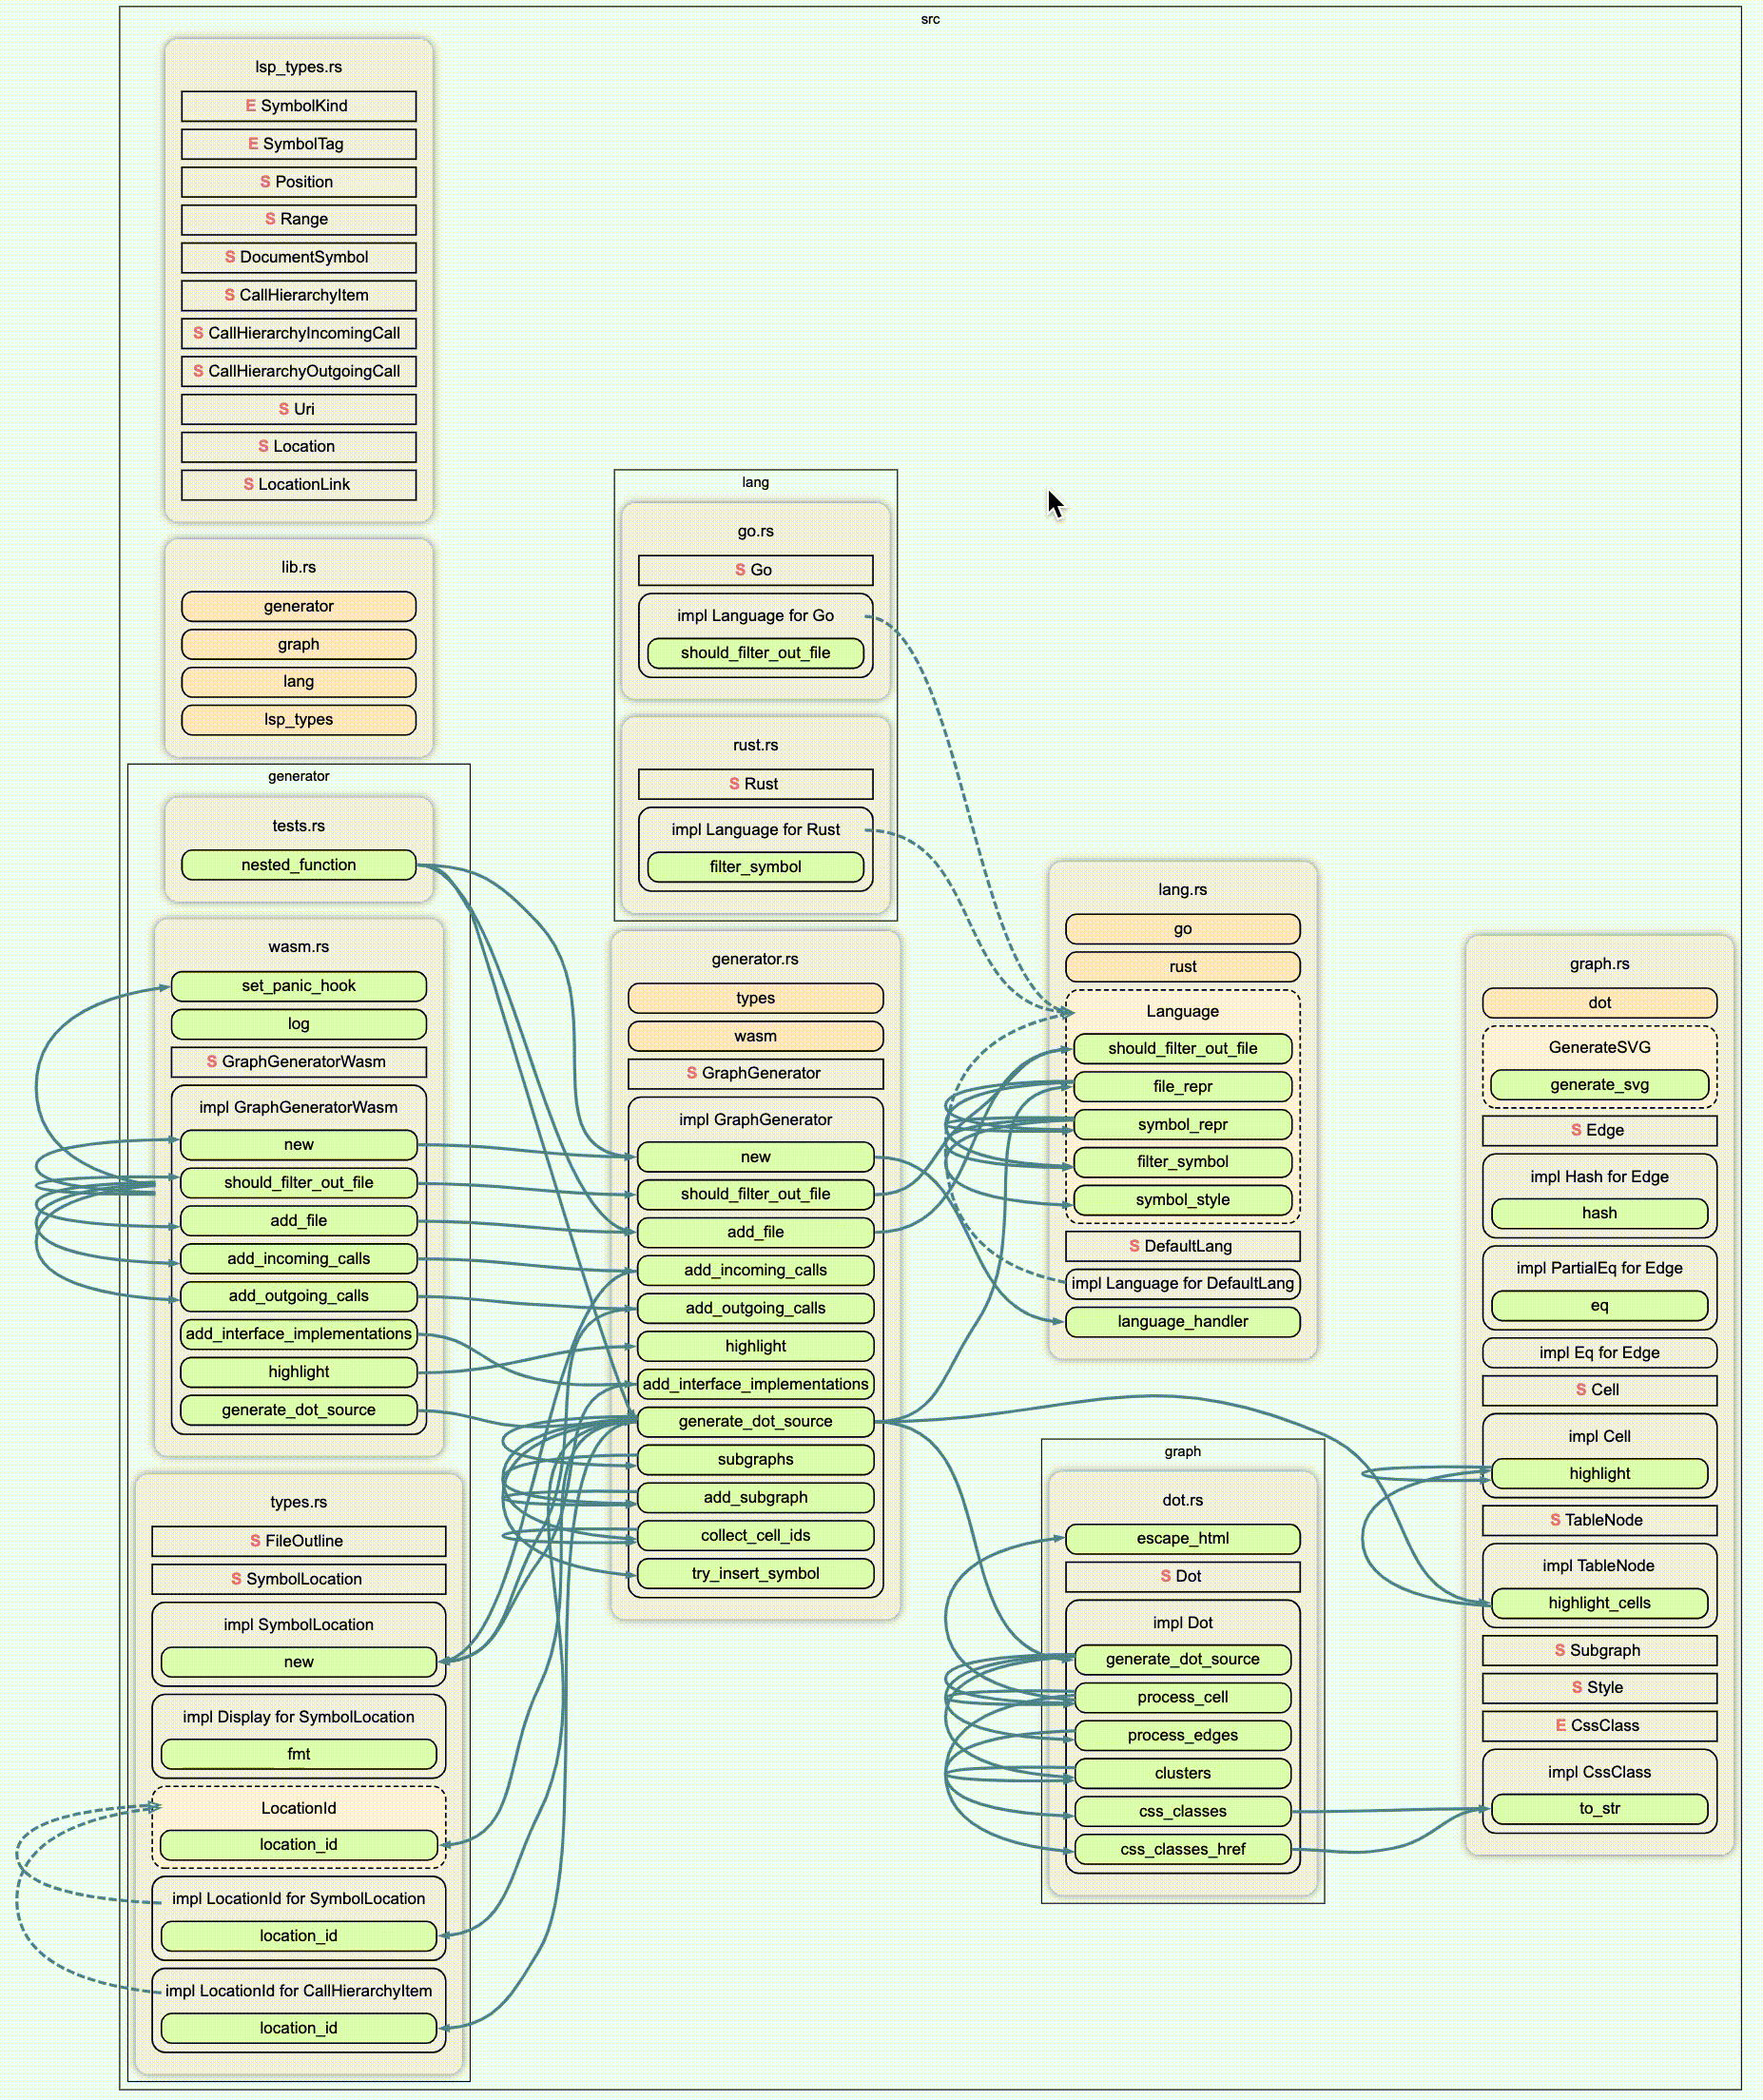
For JAVA, C and C++ the call graph is quite different:
Reading those call graphs, you can easily understand the software Architecture, as well as the Application’s Module Dependencies.
Quality Views
Further, in a single view, you can have a summary of Quality Violations for the entire Project:
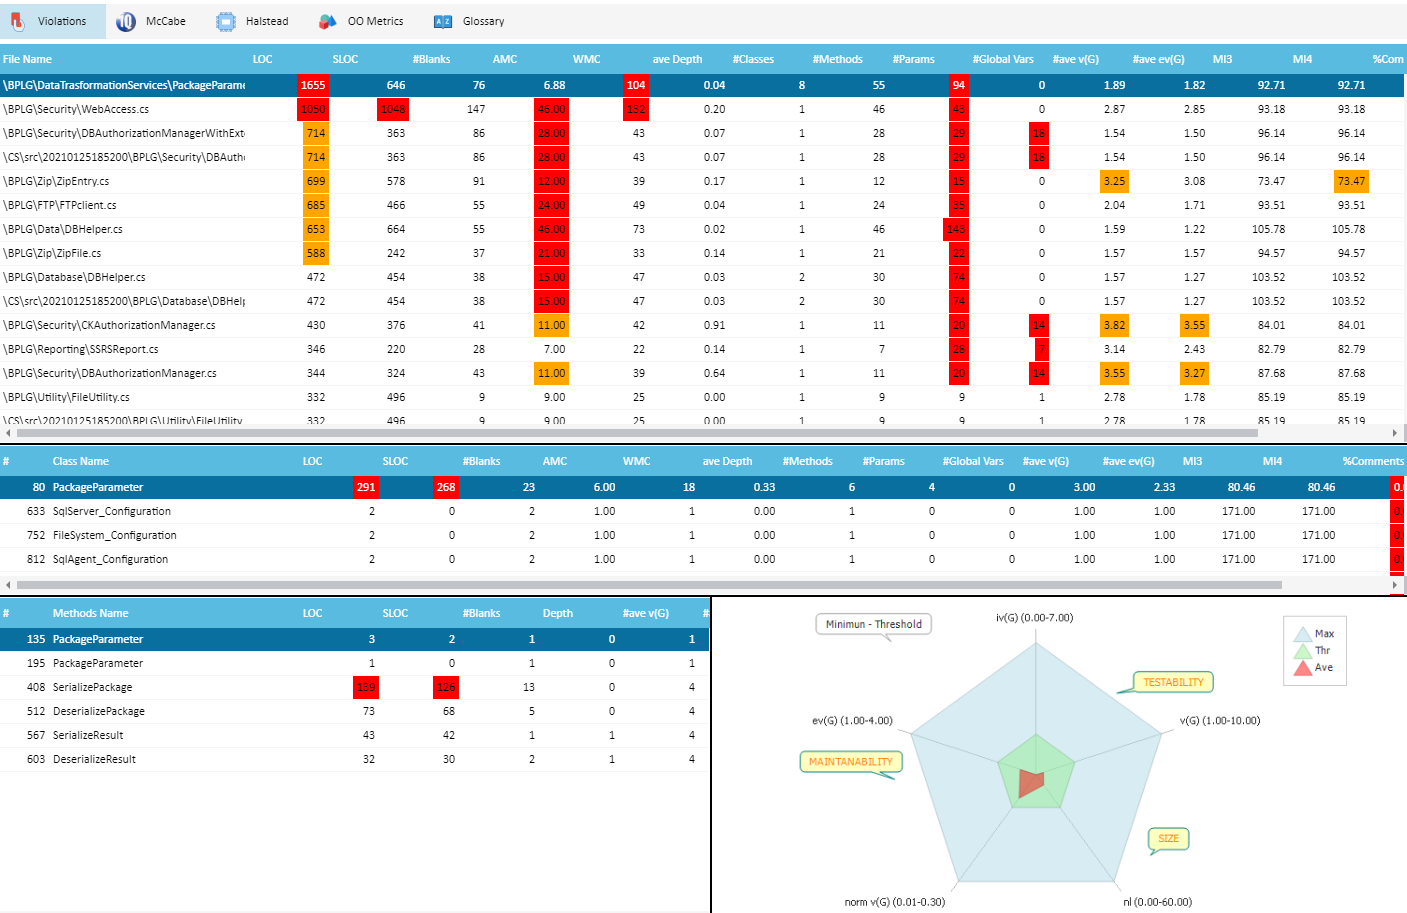
McCabe® IQ-style Kiviat graph can help to show where your Quality issues are mainly located (Maintanability, Testability or Size). For each source file, all related Classes or Programs are listed.
Anti-Patterns
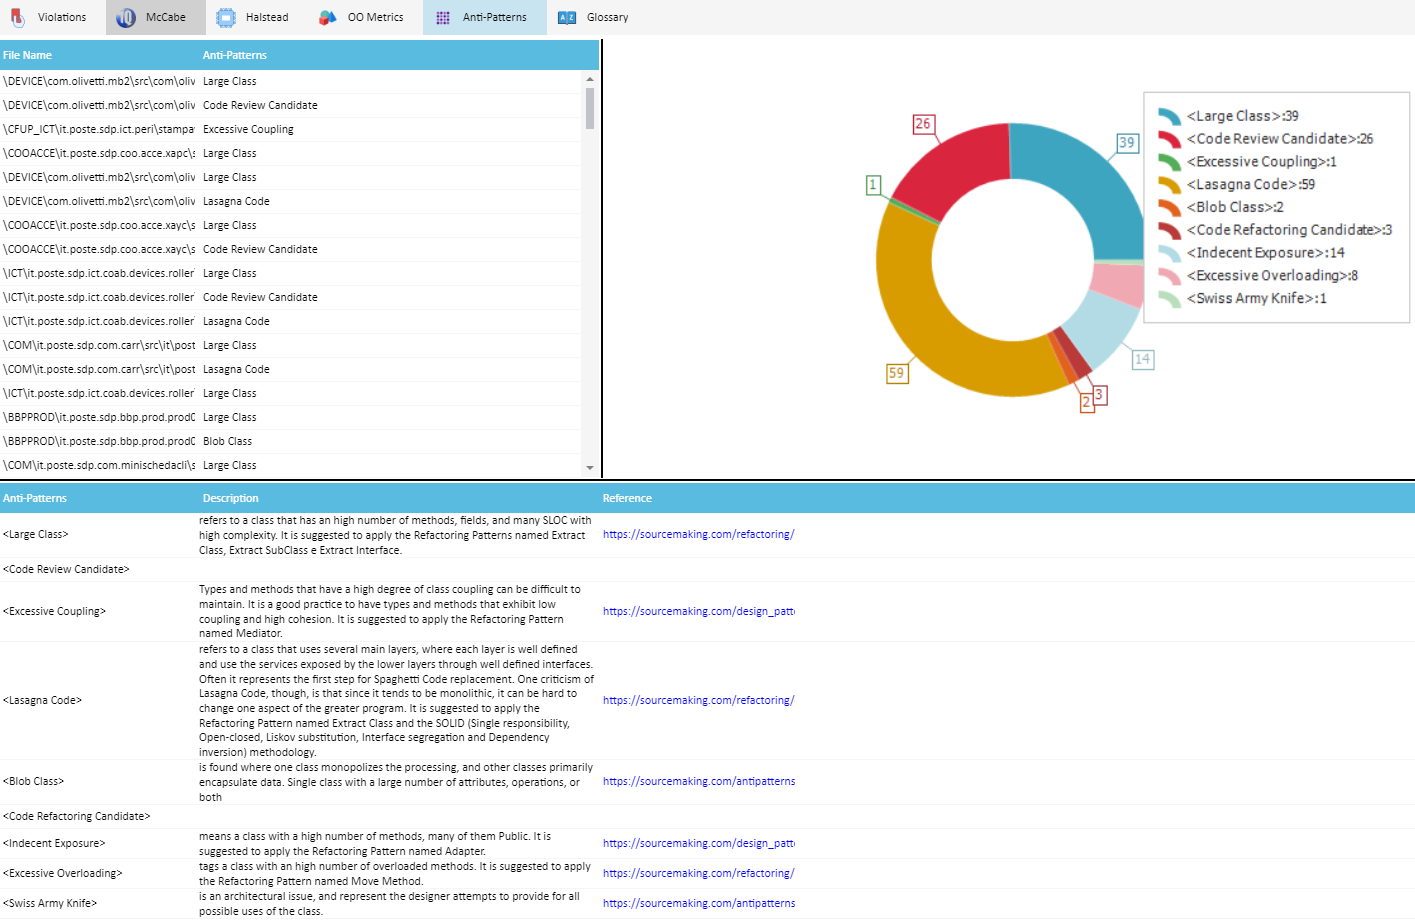
Anti-patterns are common solutions to ineffective problems and cause more problems than they solve. Anti-patterns are the opposite of best practice, which is a solution that has been proven to be effective. They are often used because they seem to work, but the larger context or the long-term consequences are often not considered. They can occur in Software Development, Architecture Design and Project Management.
Available Anti-Patterns
Software Development Anti-Patterns
Accidental Complexity
Blob Class
Code Review Candidate
Complex Class
Excessive Coupling
Excessive Overloading
Indecent Exposure
Large Class
Lava Flow
Long Method Class
Long Parameter List
Poltergeists
Speculative Generality
Architecture Anti-Patterns
Bloated Service
Dead Component
Dead Element
Deficient Encapsulation
Deficient Names
Documentation
Duplication
Functional Decomposition
Lasagna Code
Lazy Component (Class)
Refactoring Candidates
Spaghetti Code
Swiss Army Knife
Further to the above available Software Development and Architecture Anti-Patterns, you can create your own custom Anti-Patterns based on metrics’ search queries, using graphs to interpret the impact of the values. When metrics based searches provide quick access to elements of interest, saving these queries serve as input for custom analysis.
McCabe®IQ Metrics
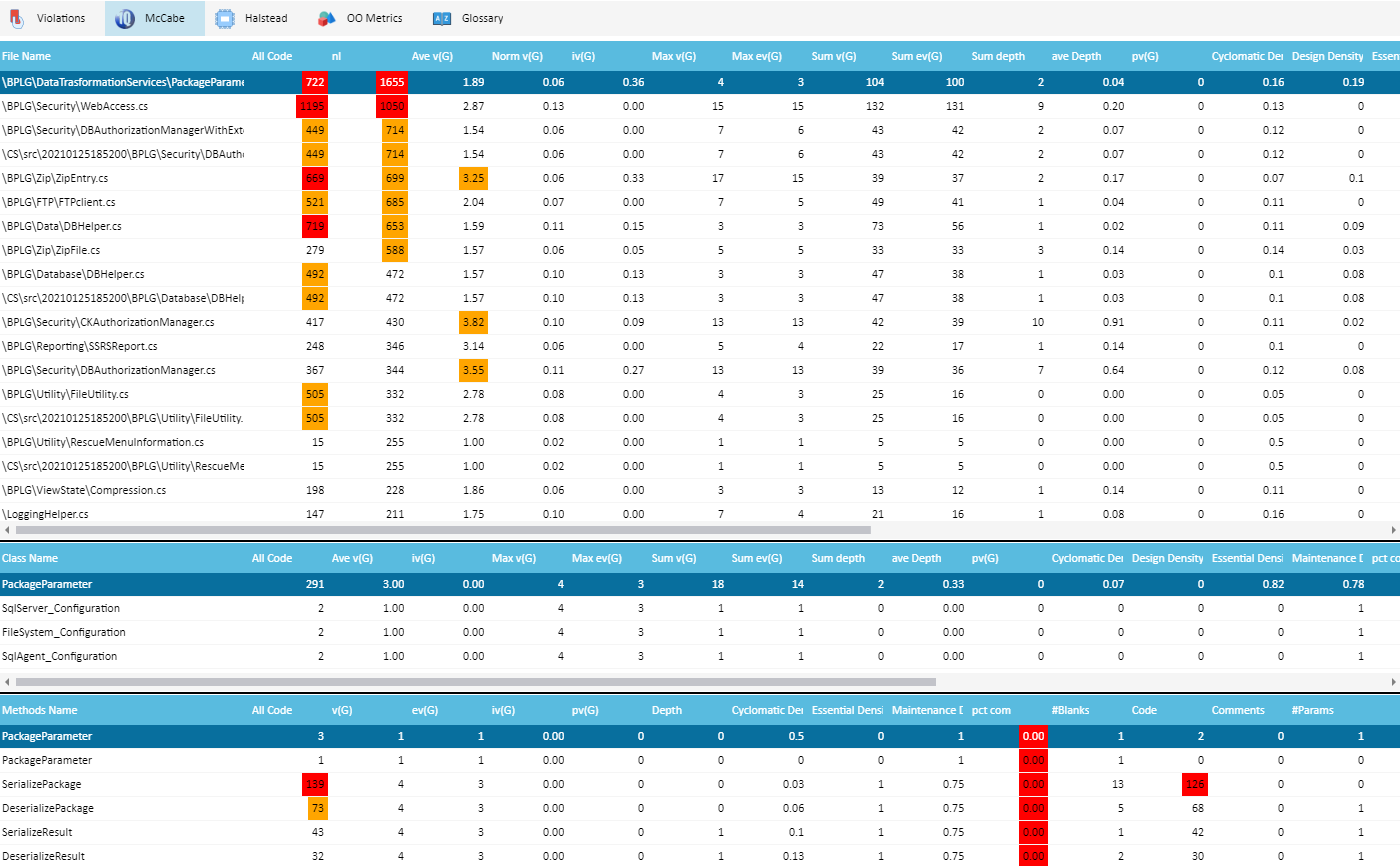
McCabe® tab shows a complete list of McCabe® metrics, with Violations marked in different colors:
Halstead Metrics
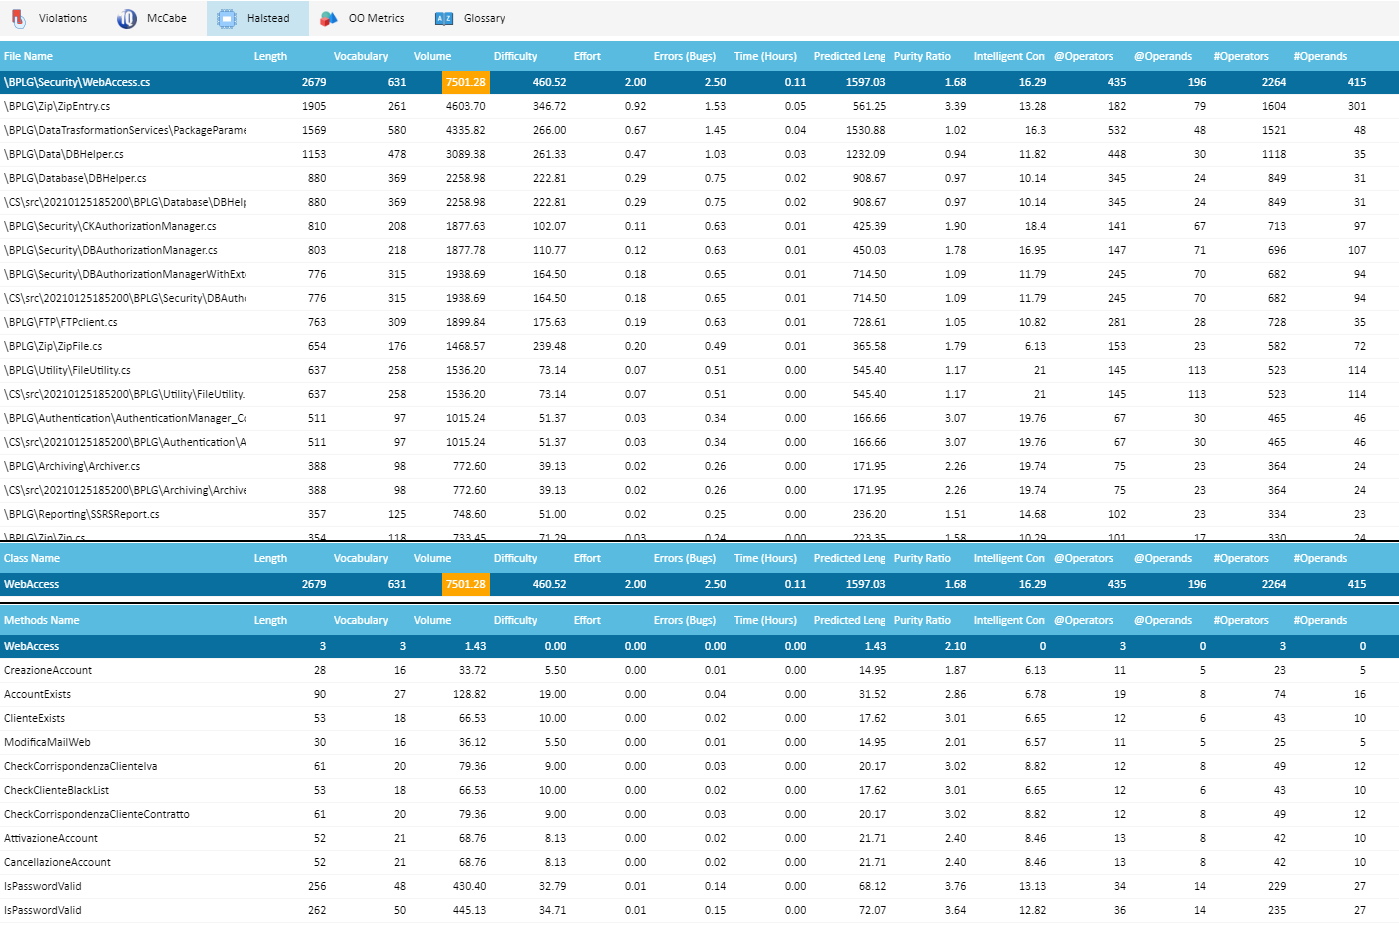
Halstead Science metrics are also provided at Application/Program, File, Class and Method/Perform level, clicking on Halstead tab:
OO Metrics
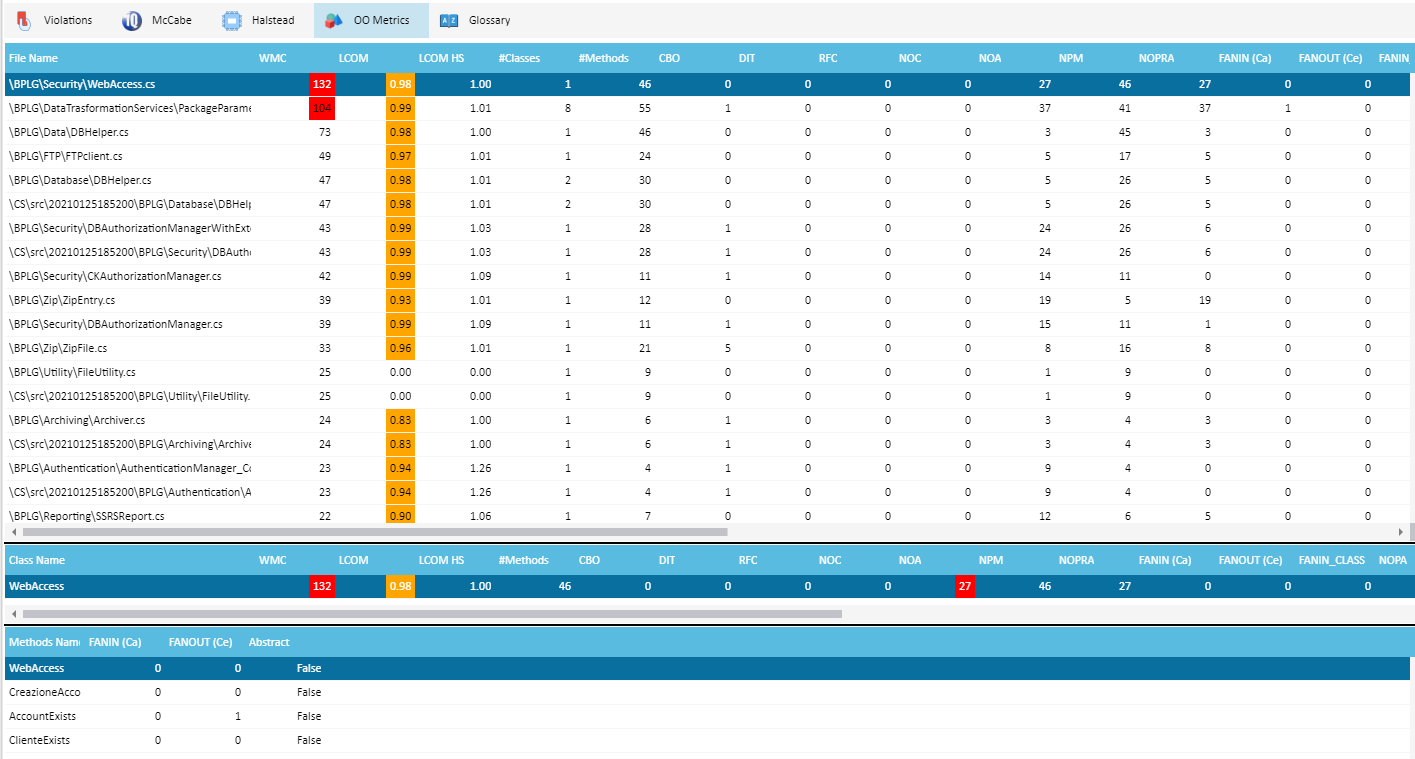
The Chidamber & Kemerer (CK) metrics suite originally consists of 6 metrics calculated for each class: WMC, LCOM, CBO, DIT, RFC and NOC. A bunch of additional Object Oriented metrics are also calculated, like Mood, Cognitive Metrics and Computed Metrics. You can view them by clicking on OO Metrics tab:
Primitive Metrics: McCabe® Cyclomatic Complexity (vG), Essential Complexity (evG) Normal vG, sum vG, ivG, pvG, Cyclomatic Density, Design Density, Essential Density, Maintenance Severity, pctcom, pctPub, PUBDATA, PUBACCESS. SEI Maintanability Index (MI3, MI4), LOC, SLOC, LLOC. Halstead Length, Vocabulary, Difficulty, Effort, Errors, Testing Time, Predicted Length, Purity Ratio, Intelligent Content. OOPLOCM, Depth, Weighted Methods Complexity (WMC), LCOM, LCOM HS, CBO, DIT, RFC, NOA, NOC, NPM, FANIN, FANOUT, #Classes, #Methods, #Interfaces, #Abstract, #Abstractness, #DepOnChild.
Computed Metrics: let you define a new higher-level metric by specifying an arbitrary set of mathematical transformations to perform on a selection of Primitive metrics. A number of Computed Metrics are provided by default, like: Class Cohesion rate, Class Size (CS), Unweighted Class Size (UWCS), Specialization/Reuse Metrics, Logical Complexity Rate (TEVG), Class Complexity Rate (TWMC), Information Flow (Kafura & Henry), ISBSG Derived Metrics, Structure Complexity, Architectural Complexity Metrics, MVC Points (Gundappa).
Quality Ranges
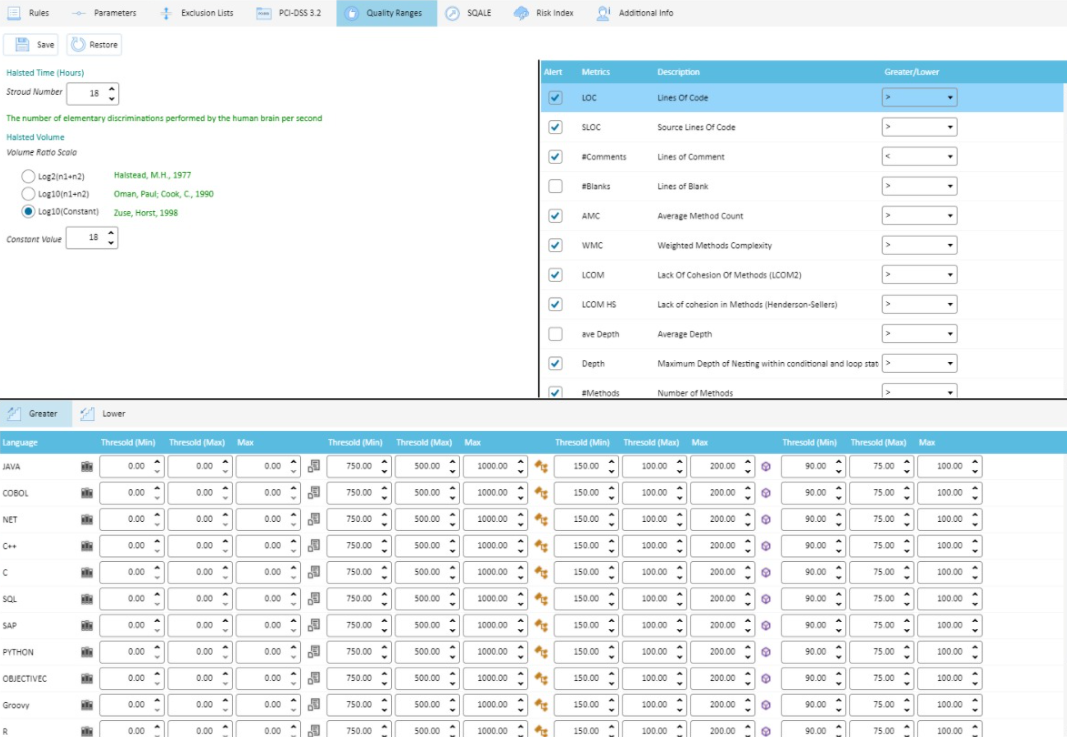
You can configure Metrics ranges, having Low-Threshold-High values, you can set Alarm limits. It can be shown graphically. You can have System (Application/Program), File, Class and Method/Perform scope view, different for each supported programming language:
Supported Programming Languages: C#, Vb.NET, VB6, ASP, ASPX, JAVA, JSP, JavaScript, TypeScript, Java Server Faces, Ruby, Python, R, GO, Clojure, Kotlin, eScript, Apex, Shell, PowerShell, LUA, HTML5, XML, XPath, C, C++, PHP, SCALA, Rust, IBM Stream Programming Language, Objective-C, Objective-C++, SWIFT, COBOL, ABAP, SAP-HANA, PL/SQL, T/SQL, Teradata SQL, SAS-SQL, ANSI SQL, IBM DB2, IBM Informix, MySQL, FireBird, PostGreSQL, SQLite.
