Effort Estimation
- Natalia Moisei
- Marco Security
- Laura Mandolini
- David Syman (Unlicensed)
Introduction
Software cost estimation is the process of predicting or calculating the cost in terms of efforts required to develop a software product. A number of factors contribute to overall cost estimation process of software but factors such as software size and its complexity affects substantially to the effort software development accurately. Many models and metrics that have been proposed over the last 50 years in the literature in order to reduce software development cost. There are several verities of Estimation, which are not very “correct”. They may have elements of rightness, a veneer of truth, but they may also be worth a critical look. A new solution is needed, starting from a different point-of-view, with higher Accuracy
Project cost estimation and Project Scheduling are normally carried out together. The costs of development are primarily the costs of the effort involved, so the effort computation is used in both the cost and the schedule estimate. However, you may have to do some cost estimation before detailed schedules are drawn up. These initial estimates may be used to establish a budget for the project, evaluate an Outsourcer or to set a price for the software for a customer. Software Cost Engineering is a profession! However, in many organizations even large projects are estimated by just asking the engineers, architects, testers, project managers and other experts to come up with the estimate, based on their experience. In the Software Cost Engineering community, this is often referred to as ‘Estimation maturity level 0’. Although these expert estimates are sometimes quite accurate, they are also subjective, not repeatable, not backed up by data, not verifiable and therefore not defensible. The problem is that humans (experts) systematically underestimate software projects and that starting software projects with unrealistically optimistic expectations usually results in huge overruns in the end. When the customer asks on what ground the estimate is based, you really don’t wish to answer: “our engineers just think so”.
OUR SOLUTION
Quality Reviewer Effort Estimation module measures and estimates the Time, Cost, Complexity, Quality and Maintainability of software project as well as Development Team Productivity by analyzing their source code, the binaries or by accepting a few parameters input. Using a modern software sizing algorithm called Average Programmer Profile Weights (APPW© 2009 by Logical Solutions), a successor to solid ancestor scientific methods as COCOMO, AFCAA REVIC, Albrecht-Gaffney, Bailey-Basili, Doty, Kemerer, Matson-Barret-Meltichamp, Miyazaki-Mori, Putnam, SEER-SEM, Walston-Felix and Function Points (COSMIC FFP, BackFired Function Points and CISQ©/OMG© Automated Function Points) following the ISO 19515:2019 standard. Providing metrics more oriented to Estimation than SEI Maintainability Index, McCabe© Cyclomatic Complexity, and Halstead Complexity. Applying ISO 18484 Six-Sigma methodology developed by Motorola© and Capers Jones© algorithm, Quality Reviewer Effort Estimation produces more accurate results than traditional software sizing tools, while being faster and simpler. By using Quality Reviewer Effort Estimation, a project manager can get insight into a software development within minutes, saving hours of browsing through the code. If Quality Reviewer Effort Estimation is applied starting from early stage development, Project Cost Prediction and Project Scheduling will be a lot more accurate, than using Traditional Cost Models. Our Effort Estimation results have been validated using a number of datasets, like NASA Top 60, NASA Top 93, Deshamais, etc.
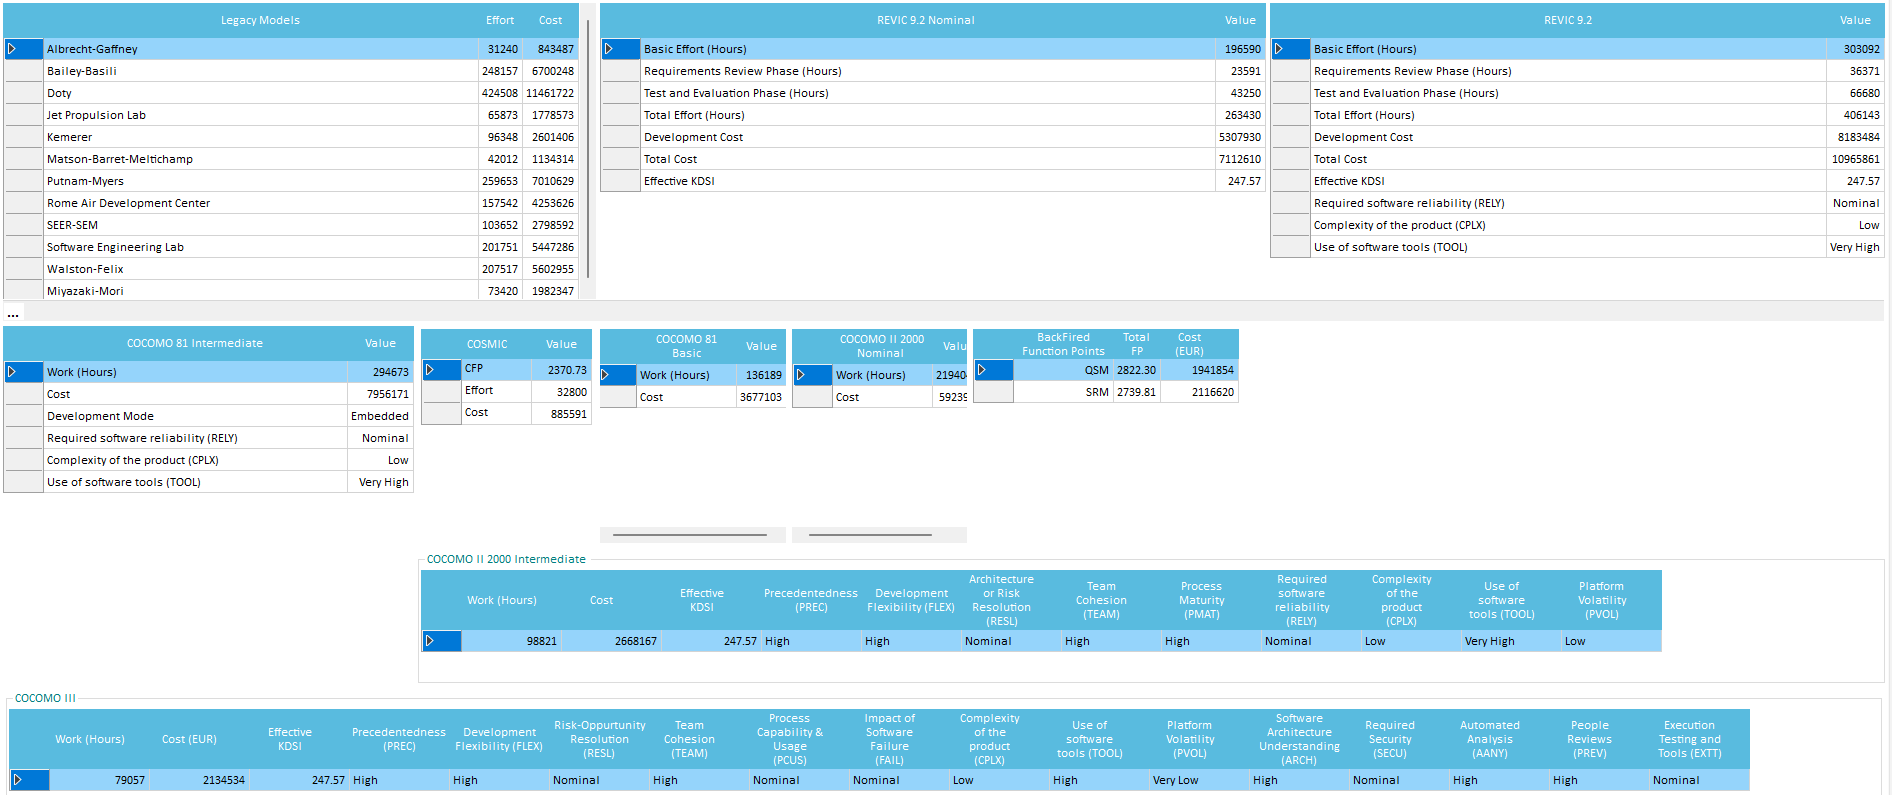
Further, our solution is the unique in the market able to calculate COCOMO III automatically.
Quality Reviewer Effort Estimation module provides integration with Application Portfolio Management (APM) solutions, such as CAST Software APM or Mega IT Portfolio Management.
Average Programmer Profile Weights©
It is specifically tailored to evaluate commercial software project development time (where management is relatively efficient) on projects of all sizes, while COCOMO was modeled mainly on large aerospace and government projects, and evaluates more factors such as design time. COSYSMO (Constructive Systems Engineering Cost Model) can evaluate hardware projects too. The REVIC model, designed for military projects also adds effort estimation for 2 optional development phases into its estimation, initial Software Specification Review, and a final Development Test and Evaluation phase. Function Points (in most of its flavors, mainly IFPUG and NESMA) uses general complexity and functionality assessments for estimating a "user perceived" functionality, while APPW© uses several different complexities (such as control flow and arithmetic) to assess a "developer perceived" functionality. Due to the model complexity, APPW© realistically requires a project source code analyzed (either current code or a similar one as an analogy), while COCOMO, COSMIC-FFP, COSYSMO, REVIC and Function Points allow you to guess the size (in LLOC) of the software yourself. So in effect, they are complementary.
COSMIC - FFP
The COSMIC-FFP software model distinguishes four types of data movement sub-process: in the “front-end” direction, two types of movement (Entry and eXit) allow to exchange of data attributes with the users (or other layers); in the “back-end” direction, two types of movement (Read and Write) allow the exchange of data attributes with the storage hardware. The COSMIC-FFP measurement rules and procedures are then applied to the software model in order to produce a numerical figure representing the functional size of the software, layer by layer. The unit of measurement is 1 data movement, referred to as 1 COSMIC Functional Size Unit (CFSU). Quality Reviewer - Effort Estimation provides COSMIC FFP, as well as the related Effort and Cost:
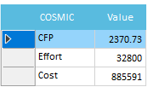
Conceptually, the mapping phase of the COSMIC-FFP method can be considered as a process of “viewing” a software from different level of functional details. COSMIC Functional size of software can be measured precisely after functional specification stage. However, functional specification is often completed relatively late in the development process and a significant portion of the budget has already been spent. So, COSMIC-FFP measured during development has often a higher level of precision respect the Early & Quick method. Together with APPW©, COSMIC-FFP and Automated FP™ represent the more accurate measurement methods based on source code, provided all-together by Quality Reviewer-Effort Estimation only. Further, Quality Reviewer provides COSMIC Design Effort, Build Effort and Test Effort metrics.
BACKFIRED FP
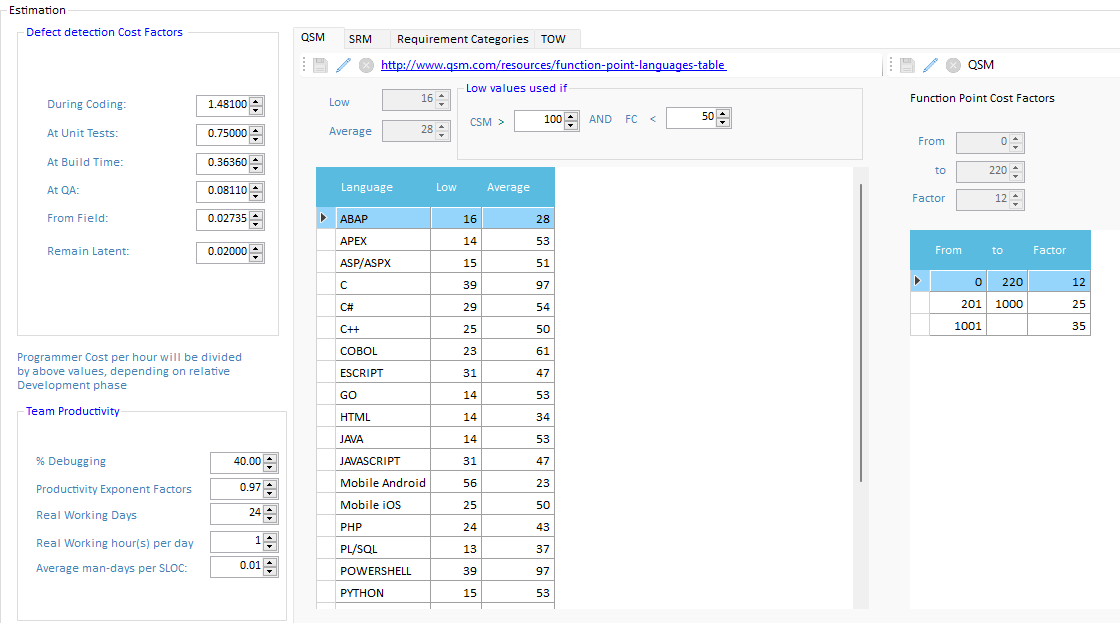
Quality Reviewer-Effort Estimation computes two different BackFired Function Point based on QSM and SRM methods. While SRM (developed by Capers Jones, Namcook Analytics ltd) is a traditional Back Firing method based on a single coefficient per programming language (last updated: 2014), the QSM Function Points Languages Table contains continuously updated function point language gearing factors for 37 distinct programming languages/technologies. Quality Reviewer-Effort Estimation module computes QSM FP using two different coefficients (Low and Average), depending of some configurable project’s attributes like CSM (Code Structure Modularity) and FC (Flow Complexity).
OMG® AUTOMATED FP
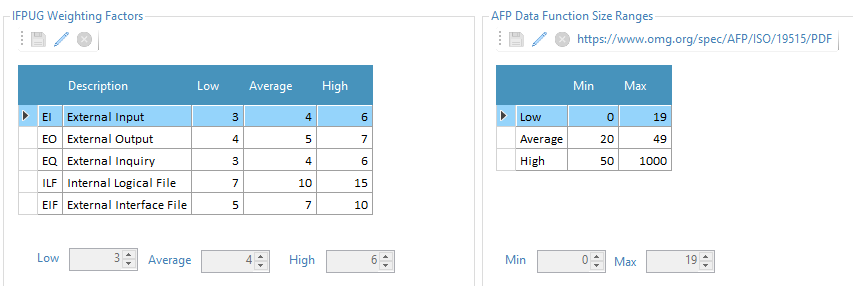
Quality Reviewer-Effort Estimation Automated Function Points™ (AFP) ISO 19515:2019 capability is an automatic function points counting method based on the rules defined by the International Function Point User Group (IFPUG®) (http://www.ifpug.org/). It automates this manual counting process by using the structural information retrieved by source code analysis (including OMG® recommendation about which files and libraries to exclude), database structure (data definition files), flat files (user maintained data) and transactions. The Object Management Group (OMG®) Board of Directors has adopted the Automated Function Point (AFP) specification in 2013. The push for adoption was led by the Consortium for IT Software Quality (CISQ®). Automated Function Points demonstrates a 10 X reduction in the cost of manual counted function points, and they aren't estimations; they're counts — consistent from count to count and person to person. Even more importantly, the standard is detailed enough to be automatable; i.e., it can be carried out by a program. This means it's cheap, consistent, and simple to use — a major maturation of the technology.
COCOMO - REVIC
For Basic COCOMO results, the static formula for Organic Projects of the Basic COCOMO model is used, applying LLOC (Logical Lines of Code) alone. For the Intermediate COCOMO results and for Revised Intermediate COCOMO (REVIC) model, they use automatic measurements of the source code to configure some of the cost drivers. Quality Reviewer- Effort Estimation module provides a more accurate calculation of LLOC, strictly based on Software Engineer Institute (SEI) specifications.
DIFFERENTIAL COMPARISON
This process enables comparing an older version of the project to a newer one, as results will measure the time and cost of the delta (change) between the two versions. This Effort estimation option performs a truly differential source code comparison, since analysis is based on a parser, free from the "negative SLOC" problem.
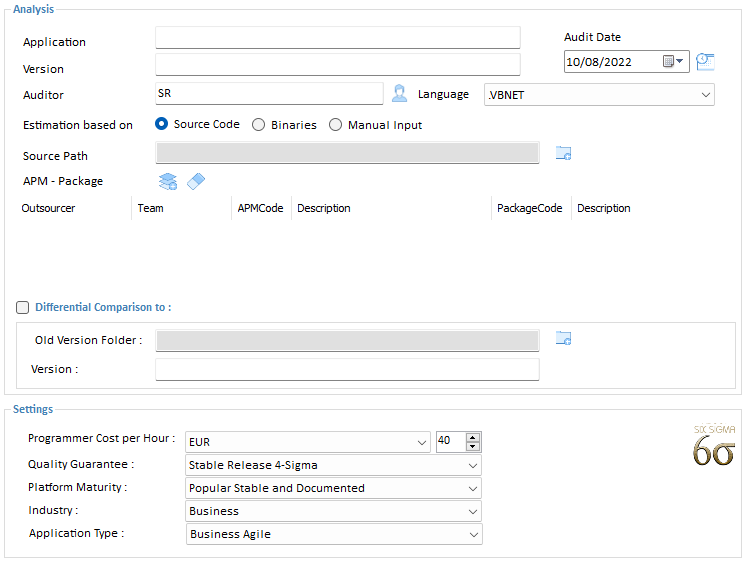
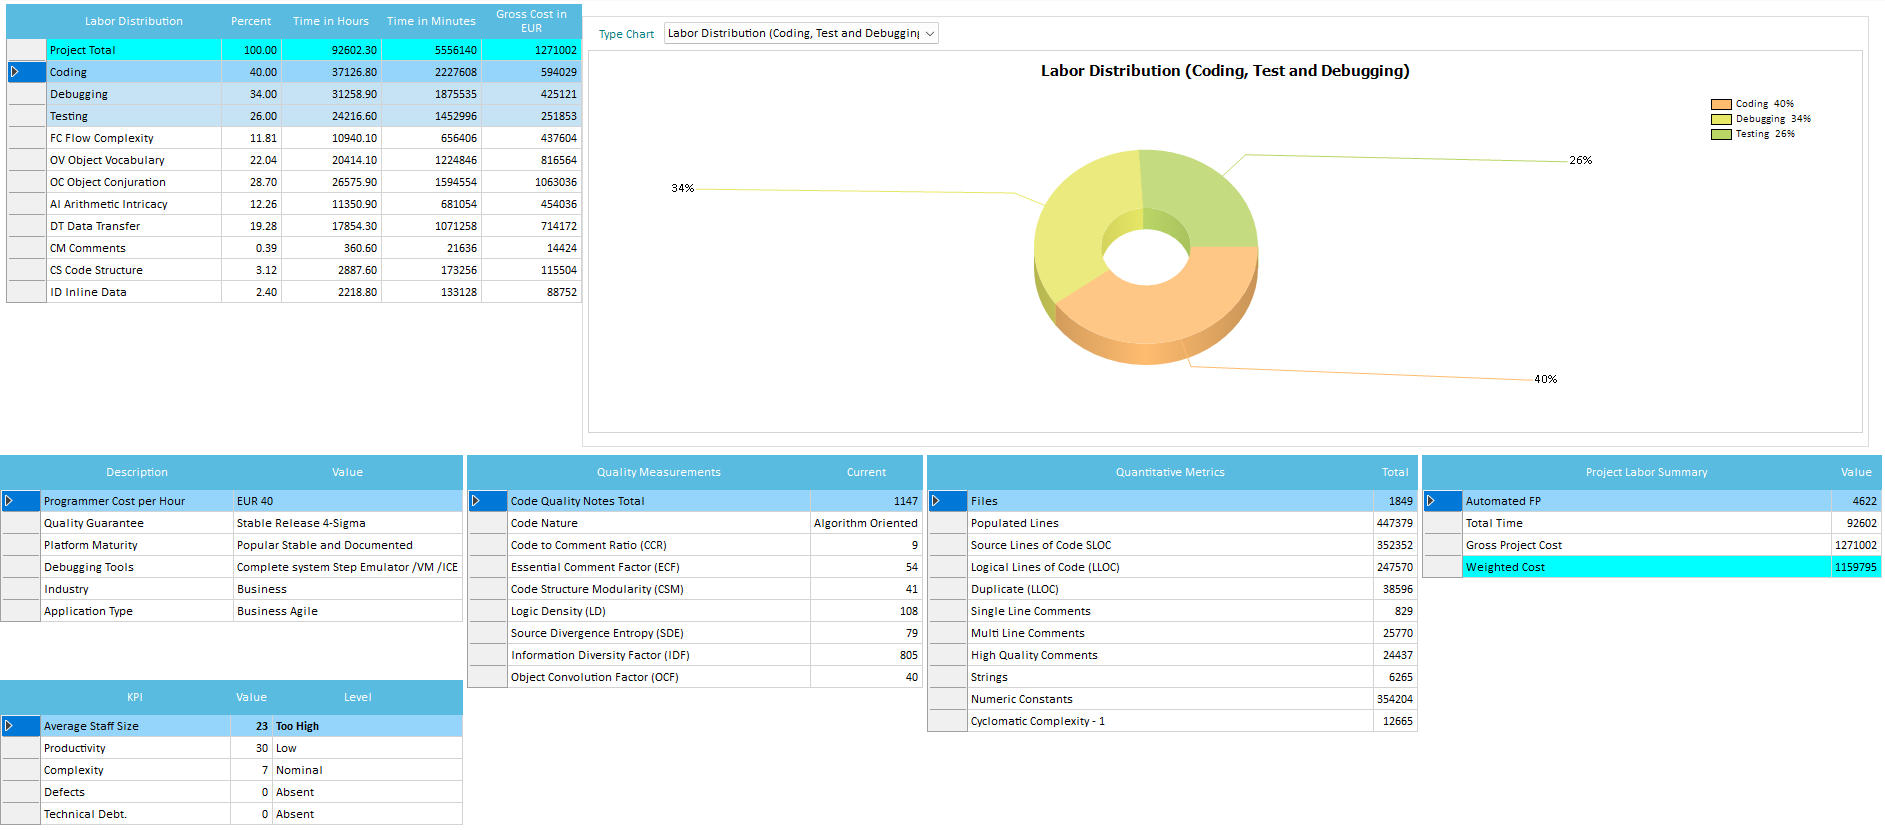
Programming Cost per Hour
Enter the Programmer’s average hourly rate when measuring their combined source code, and select the currency you want to appear in all screens and reports. This hourly rate will be used as reference for calculating the Weighted Cost for the different phases of development life cycle, using Capers Jones algorithm.
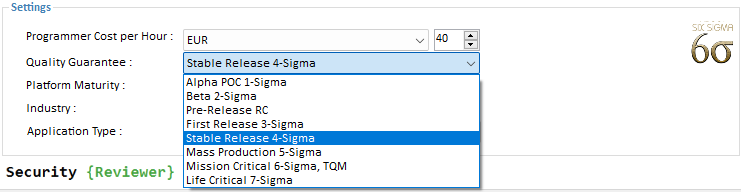
Quality Guarantee
Select the Product Quality guaranteed by the Programmers' contract. The amount of Quality Assurance (QA) testing which has be done on the project determines its failure rate. Quality levels, stated in Motorola© Six-Sigma methodology, are according to the standard Process Fallout model. It is measuring in long term Defects per Million:
1-Sigma Alpha POC 691462 Defects / Million
2-Sigma Beta Release 308538 Defects / Million
3-Sigma First Release 66807 Defects / Million
4-Sigma Stable Release 6210 Defects / Million
5-Sigma Mass Production 233 Defects / Million
6-Sigma Mission Critical 3.4 Defects / Million
7-Sigma Life Critical 0.019 Defects / Million
Although originally developed for manufacturing in the context of tolerance-based specifications, the Six Sigma concept has been operationalized to any process and has come to signify a generic quality level of at most 3.4 defects per million opportunities.
Platform Maturity
The quality of the underlying system platform, measured in average stability and support for all the platform parts, including the Function library API, Operating System, Hardware, and Development Tools.
Industry & Application Type
It is a simplified Industry sector and Application Type classification, for compatibility with available Datasets.
Security Reviewer stratifies Project data into homogenous subsets to reduce variation and study the behavioral characteristics of different software application domains.
Stratifying the data by Application Type reduces the variability at each size range and allows for more accurate curve fitting.
| Industry | Application Type |
|---|---|
Business | Financial Feature |
| Command & Control | Military Solutions Command Control Processes Command Structures Command Control Processes Informational Decisions Organizational Decisions Operational Decisions Information Push Information Pull Communication Networks Headquarter/Branch Information Systems National Architecture Stategic Architecture Operational Architecture Tactical Architecture Command System Services Elements Functional Area Software Support Subsystem Elements Operational Center Elements Document Management Geo-referencing Toponomastic Services Profiling Configuration & Administration Reporting User Interface External Systems Interface Anomaly behavior analysis Training Customer Support Software Development EDWH, BI, Data Lake Business Continuity Management |
| Scientific/AI | Solving Eigenvalues Solving Non-linear Equations Structured grids Unstructured grids Dense linear algebra Sparse linear algebra Particles Monte Carlo Nanoscale Multiscale Environment Climate Chemistry Bioenergy Combustion Fusion Nuclear Energy Multiphysics Astrophysics Molecolar Physics Nuclear Physics Accelerator Physics Quantum chromodynamics (QCD) Aerodynamics Out-of-core algorithms Accelerator Design Document Management Geo-referencing Toponomastic Services Profiling Configuration & Administration Reporting User Interface External Systems Interface Anomaly behavior analysis Training Customer Support Software Development EDWH, BI, Data Lake Business Continuity Management |
| System Software | Fast Fourier Trasform (FFT) Interpolation Linear Solver Linear Least Squares Mesh Generation Numerical Integration Optimization Ordinary Differetail Equations (ODE) Solver Random Number Generator Partial Differential Equations (PDE) Solver Stochastic Simulation Concurrent Systems Security and Privacy Resource Sharing Hardware and Software Changes Portable Operating System Backward Compatibility Specific Type of Users Programming Language Changes Multiple Graphical User Interface System Library Changes File System Changes Task Management Changes Memory Management Changes File Management Changes Device Management Changes Device Drivers Changes Kernel Changes Hardware Abastraction Layer (HAL) Changes Document Management Profiling Configuration & Administration Reporting External Systems Interface Anomaly behavior analysis Training Customer Support Software Development Business Continuity Management |
| Telecommunications | Network Security and Privacy Core Mobile Portable Operating System Backward Compatibility Specific Type of Users Programming Language Changes Multiple Graphical User Interface System Library Changes File System Changes Task Management Changes Memory Management Changes File Management Changes Device Management Changes Device Drivers Changes Kernel Changes Hardware Abastraction Layer (HAL) Changes Document Management Profiling Configuration & Administration Reporting External Systems Interface Anomaly behavior analysis Training Customer Support Software Development Business Continuity Management |
| Process Control/Manufacturing | Job and Work Order Management Security and Privacy Labor Management Master Data Management Plant Management Production Schedule Production Process Design Work Order Material Sales Order Management Quality Management Inventory Management CAD/CAM Management Bill of Material (BOM) Management Product Lifecycle Management (PLM) Material Requirements Planning (MRP) Volatile Data Streams (VDS) Query-able Data Repository (QDR) Communication Interfaces Document Management Profiling Configuration & Administration Reporting External Systems Interface Anomaly behavior analysis Training Customer Support Software Development Business Continuity Management |
| Aerospace/Transportation/Automotive | Sensor Fusion Communications Motion Planning Trajectory Generation Task Allocation and Scheduling Cooperative Tactits Production Process Design Aircraft Platform Changes Tactical Control System Security Regulatory Compliance Mission Validation Autonomous Operations Scheduled Pickup Auto Carrier Multimodal Shipment Performance Tracking Cargo Tracking Localization Driver Dispatch Machine in the LooP Driver in the Loop Virtual Simulation Closed-Circuit testing Road testing Communication Interfaces Document Management Profiling Configuration & Administration Business Intelligence Reporting External Systems Interface Anomaly behavior analysis Training Customer Support Software Development Business Continuity Management |
| Microcode/Firmware | Regulatory Compliance Final Safety Analysis Report (FSAR) Equipment Design Design Base and Licensing Safety Significance Complexity and Failure Analysis Vendor and product evaluation Equipment qualification Enhanced human machine interface (HMI) Software Safety and Risk (EPRI) Security Basic System Failure, Fault and Harm Digital System Fault, Bug and Errors. (BTP) HICB-14, IEEE Std 982.1-1988 Sources and Levels of Digital Risk Diversity and Defense Quality Assurance (QA) Software Verification & Validation (V&V) Communication Interfaces Document Management Profiling Configuration & Administration Business Intelligence Reporting External Systems Interface Anomaly behavior analysis Training Customer Support Software Development Business Continuity Management |
| Real-time Embedded/Medical | Regulatory Compliance Final Safety Analysis Report (FSAR) Equipment Design Design Base and Licensing Safety Significance Full Feed Control Systems Data Acquisition Systems Programmed Controllers Reduced real-time Systems Complexity and Failure Analysis Vendor and product evaluation Equipment qualification Enhanced human machine interface (HMI) Software Safety and Risk (EPRI) Security Basic System Failure, Fault and Harm Digital System Fault, Bug and Errors. (BTP) HICB-14, IEEE Std 982.1-1988 Sources and Levels of Digital Risk Diversity and Defense Quality Assurance (QA) Software Verification & Validation (V&V) Communication Interfaces Document Management Profiling Configuration & Administration Business Intelligence Reporting External Systems Interface Anomaly behavior analysis Training Customer Support Software Development Business Continuity Management |
Current Application will be compared with 8000+ validated Software Projects, collected anonymously by country since 2013, and related to Industry sector and Application Type selected.
We recently cut older 5000+ Projects from the repository, collected before 2013, considered outdated. A Blockchain is used for the comparison.
Only Software Projects rated Medium or High confidence are used in our Industry trend lines and research.
Before being added to the repository, incoming Projects are carefully screened. On average, we reject about one third of the Projects screened per update.
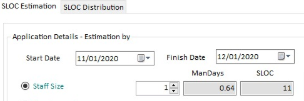
Manual Estimation
When neither Source Code nor Binaries are available, the Estimation can be done via a few manual input.
Once chosen the Project's Start and Finish Date, the Estimation can be based on:
Staff Size
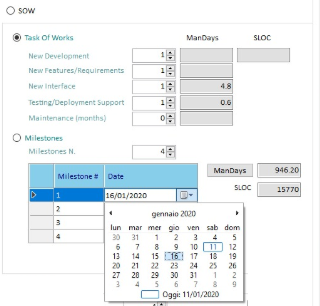
Statement Of Work
(Estimation based on Task Of Works-TOW or Milestones.
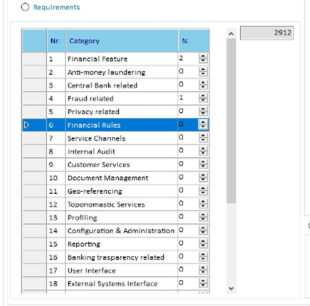
- Requirements
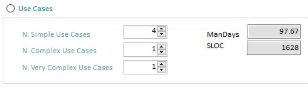
Use Cases
Low Code
Our solution provides unique features about Low Code apps Estimation. It supports a large number of Low-code Platforms.
Through input of few parameters, Quality Reviewer-Effort Estimation is able of Estimate the Low Code App Development:
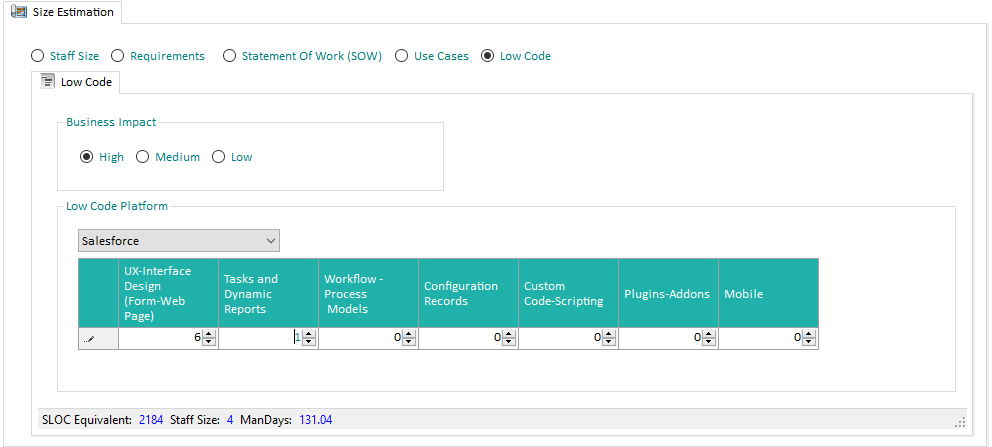
Different input is required, depending on selected Low Code Platform.
Distribution
After the Manual Input described above, the Estimated size (in Source Lines Of Code-SLOC) can be modulated by choosing a statistical Distribution algorithm:
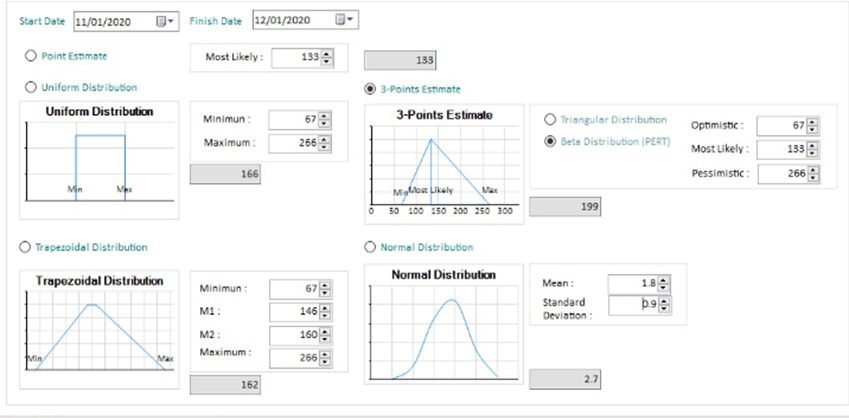
By default, 3-Points Estimation is adopted. 3-Point Estimation improves accuracy by considering uncertainty arising out of Project Risks.
3-Point Estimation is based on 3 different estimated values to improve the result. The concept is applicable for both Cost and Duration Estimation.
3-Point Estimate helps in mitigating the Estimation Risk. It takes into consideration uncertainty and associated risks while estimating values. The estimation can be done for an entire project, or for a WBS component or for an activity
Reporting
Reports are available in PDF, CSV and Word formats, localized in 4 languages
The ISO 9001-Compliant Cover is customizable with your logo, the Responsability chain as well as the Confidentiality Level.
Each result grid can be positioned as you want in the report, and you can add additional notes.
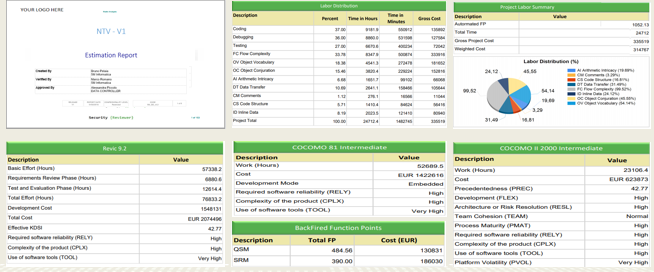
Cost model optimal use case comparison table
Function Points and APPW© are linear, which makes them suitable form measuring version differences, while COCOMO, COSYSMO and REVIC are logarithmic. At first glance, as COCOMO gives an overall project cost and time, you may subtract the WMFP result value from the equivalent COCOMO result value to get the design stage estimation:
(COCOMO.Cost) - (APPW.Cost) = (Design.Stage.Cost)
But in effect COCOMO and APPW© produce asymmetric results, as COCOMO estimates may be lower at times than the APPW© estimates, specifically on logically complex projects, as APPW© takes complexity into account.
Note that estimation of design phase time and costs may not be very accurate, as many statistical variations exist between projects. COCOMO statistical model is based on data gathered primarily from large industrial and military software projects, and is not very suitable for small to medium commercial projects.
Cost Model | Best Fit Environment | Formula type |
COCOMO | Large corporate and government software projects, including embedded firmware | Logarithmic |
COSYSMO | Large corporate and government projects, including embedded firmware and hardware | Logarithmic |
Function Points | Software projects of all sizes, mainly desktop OS based platforms | Linear |
Average Programmer Profile Weights (APPW) | Commercial and Service-Oriented software projects of all sizes and environments, including embedded firmware | Linear |
REVIC | Large military software projects, including embedded firmware | Logarithmic |
A Cost of Change is also calculated, as well as N.of Changed Files, SLOC delta, LLOC delta and Complexity delta.
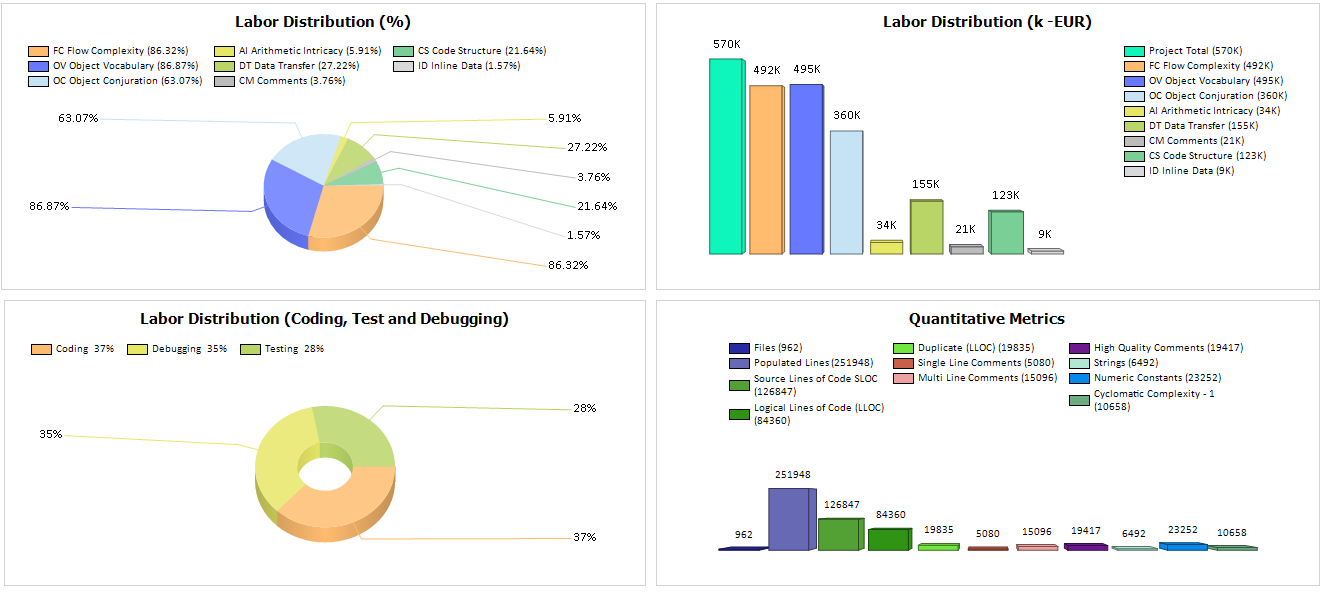
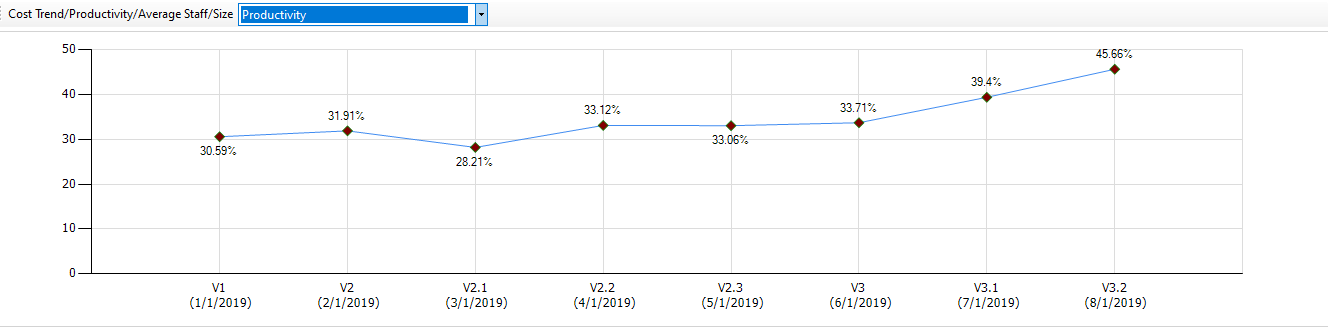
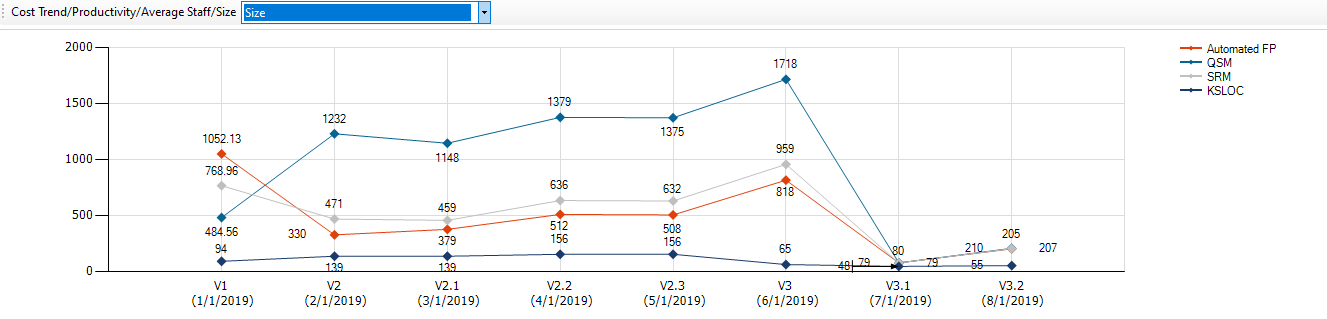
Qualitative Metrics and Development Time details
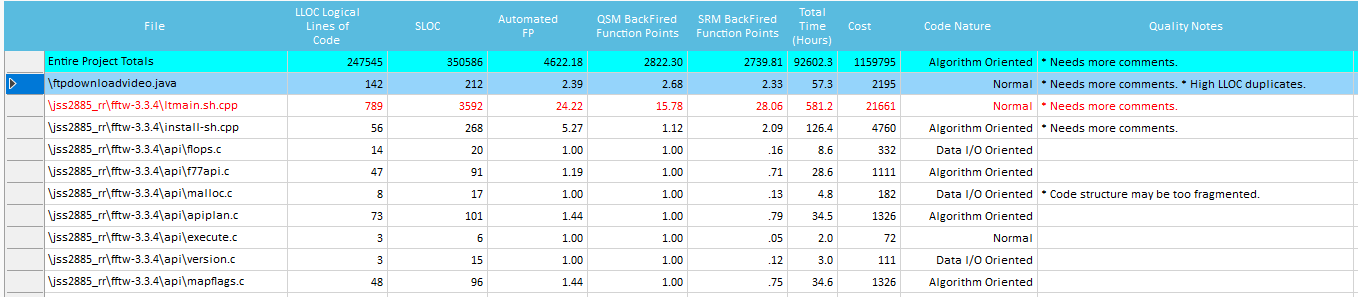
Those grids show, for each source file analyzed, the single Quality metrics used during Estimation, in terms of values and time spent:
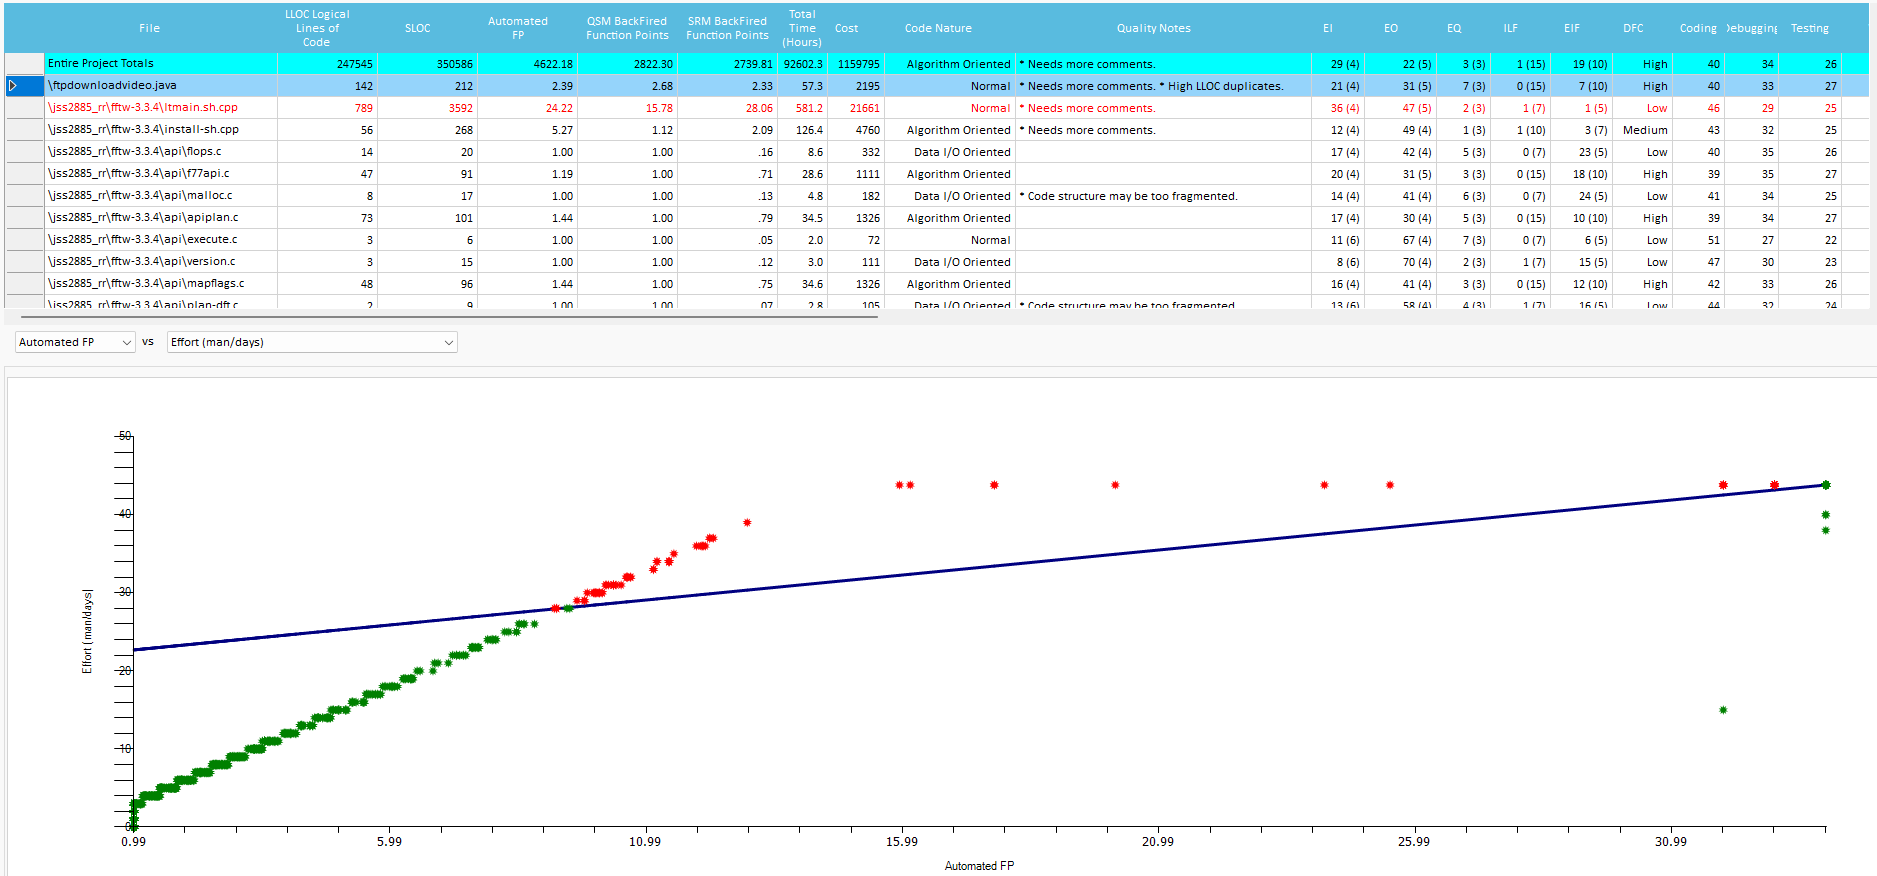
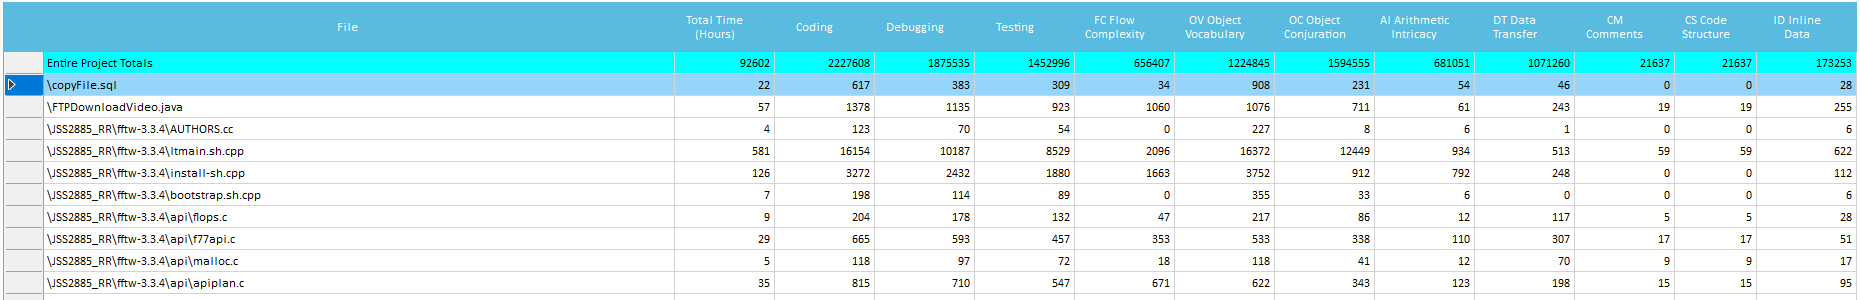
The distribution regarding Effort (Time) and Size (Automated FP, QSM FP, SRM FP, SLOC, LLOC), can be viewed graphically. You can isolate Components and/or single Files that are out-of-range.
- Total Time- Shows the calculated programmer time it took to develop that file (including coding, debugging and testing), shown both in minutes and in hours independently.
- Coding- Shows the calculated programmer time spent on coding alone on that file, shown both in minutes and in percentage of total file development time.
- Debugging- Shows the calculated programmer time spent on debugging alone on that file, shown both in minutes and in percentage of total file development time.
- Testing- Shows the calculated programmer time spent on testing alone on that file, shown both in minutes and in percentage of total file development time.
- Flow Complexity, Object Vocabulary, Object Conjuration, Arithmetic, Data Transfer, Code Structure, Inline Data, Comments- Shows the correlating WMFP© source code metric measured for that file, shown both in minutes and in percentage of total file development time.
- CCR, ECF, CSM, LD, SDE, IDF, OCF- Shows the correlating calculated Code Quality Metrics (see related section below) for that file, shown in absolute value.
- LLOC, Strings, Numeric Constants- Shows the counted Quantitative Metrics for that file, shown in absolute value.
- Code Nature, Quality Notes- Shows warnings on problematic source code qualities and attributes.
Such Quality Notes warn on some basic coding issues (based on measured source code qualities) that affect Maintainability, Reuse and Peer Review. These are good practice guidelines to make sure the estimation is effective, and the code will be easy to understand and maintain:
- Many numeric constants, may be auto-generated- Appears when too many hard coded numbers are inside a source file. Often automated tools are used for generating these types of embedded data, without using standard ‘Auto-Generated’ or ‘generated by’ tags, so this file effort may be over-estimated. Ask your developers if this file was auto-generated; if so do not include it in the analysis.
- May be auto-generated- Appears when there is some indication that automated tools created the source file, so this file effort may be over-estimated. Ask your developer if this file was auto-generated; if so do not include it in the analysis.
- Code structure can be simplified. - Appears when code structure (functions, classes, variables) is very complex, this may be due to one or more reasons:
- Unnecessarily long variable, class or function names
over dividing the code to small files, classes or functions that contain little or no code inside. - Using absolute references instead of relative, local or cached ones. For example: java.lang.String myname = java.lang.String("William")
- Using long reference chains. For example: stDressColor = MyDataStructure.users.attributes.hair.color;
- Adding redundant code syntax such as extra semicolons, braces or scopes. For example: while(((i > ))){{{ i++;;;;;;}}};;;
- Unnecessarily long variable, class or function names
Note that this may be unavoidable on complex applications or when creating an application skeleton.
Complex code structure is harder to maintain and increases the chance of errors (bugs).
- Needs more comments- Appears when there are not enough comments in the source file. Uncommented code is very hard to maintain or review.
- May need breaking down into functions or classes- Appears when source code has low modularity (bulky code) with a lot of code stuffed into a single class or function. Large code chunks are difficult to understand and review. It is recommended to split these large code blocks into smaller functions, classes or even files.
- Code structure may be too fragmented- Appears when over dividing the code into small classes or functions that contain little or no code inside. Note that this may be unavoidable on complex applications or when creating an application skeleton.
- Function and attribute nesting may need simplification- appears due to several reasons:
- Over using absolute references instead of relative, local or cached ones. For example:
java.lang.String myname = new java.lang.String("William"); //this is unnecessarily long
String myname = new String("William"); //this can be used instead
- Using long reference chains instead of cached ones. For example:
YourEyeColor = MyDataStructure.users.attributes.eye.color;
YourDressColor = MyDataStructure.users.attributes.dress.color; //this is redundant, can be cached
YouAttributes = MyDataStructure.users.attributes; //this caching can be used instead
YourEyeColor = YourAttributes.eye.color; //now it's more readable
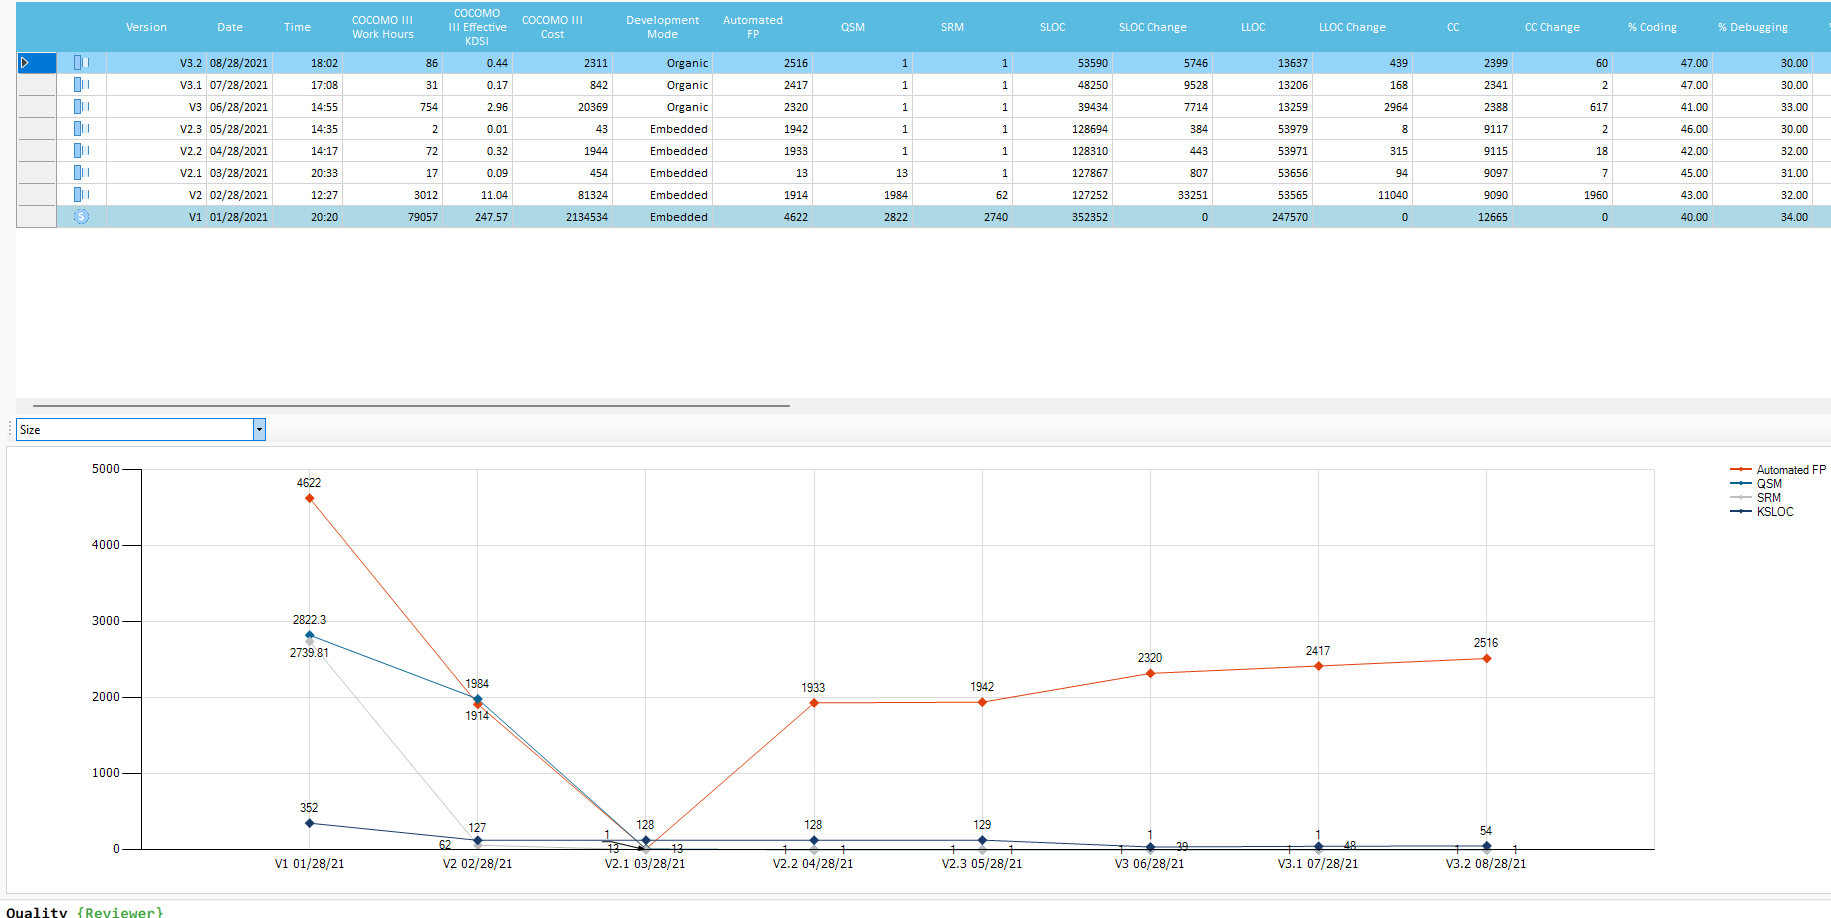
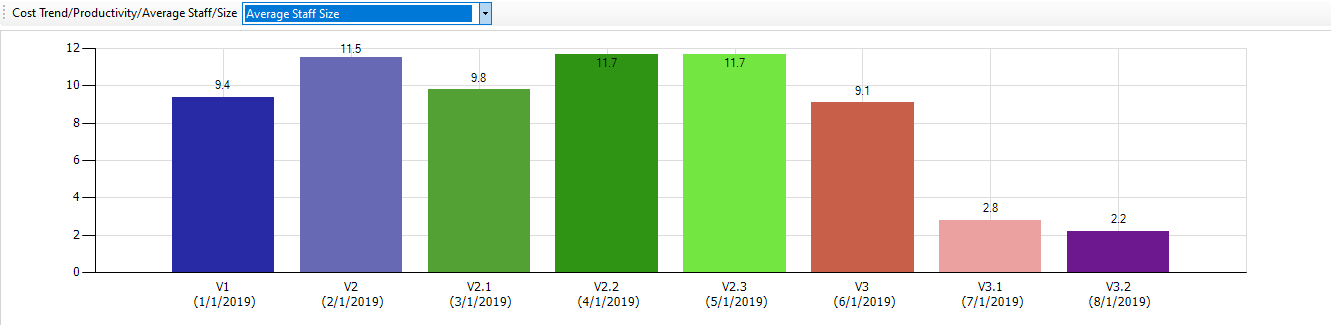
Historical Trends
Each Application Version analyzed stores statistical data for Historical Trends. Time spent on New, Modified, Refactored, Growth and Deleted operations is estimated on files change:
Defect Rating
This feature provides a simulation dashboard for calculating Cost of Defects by comparing two different scenarios:
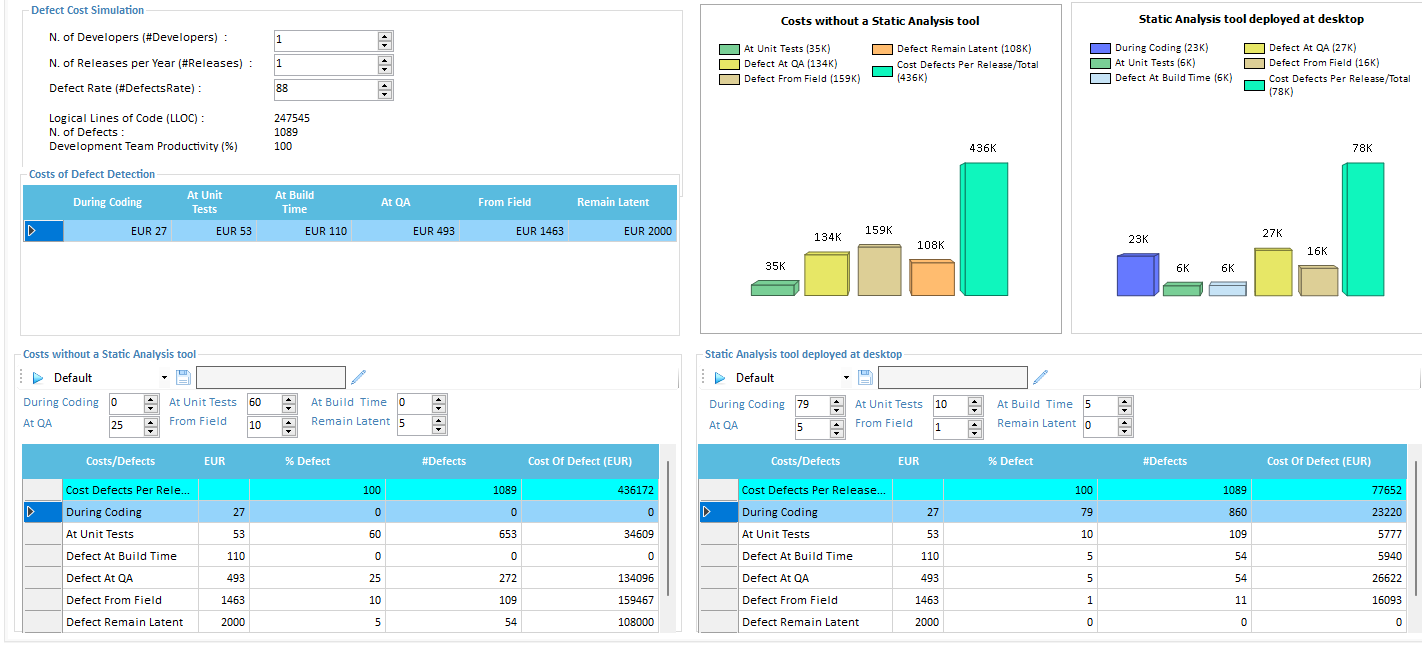
The above example shows advantage of adopting a Static Analysis tool in a development project. The cost savings of finding a bug early in the development cycle are well understood. The longer it takes to find a problem, the more expensive it is to fix, with the most costly bugs being the ones that reach customers.
The savings of preventing field-found Defects is huge, both in terms of the cost required to fix a problem once it reached customers as well as the potential for serious reputational damage. Since a Static Analysis tool highlights problems very quickly in early development stage, the cost savings identified will be very substantial.
The main scope of this simulation is to test the Cost model for Defect Rating.
Defects Trend
Security Reviewer provides a Defect Management system embedded in the solution. Once an application is analyzed, Security, Dead Code, Best Practices and Quality Defects are classified using standard SQALE severities, like Blocker (Very High), Critical (High), Major (Medium), Minor (Low) and Info (Very Low). In the following charts we take into account Blocker and Critical Defects only.
The Defect Trends graph shows latest 12 versions and their Defects (All, Blocker and Critical), respect than related Industry standard.
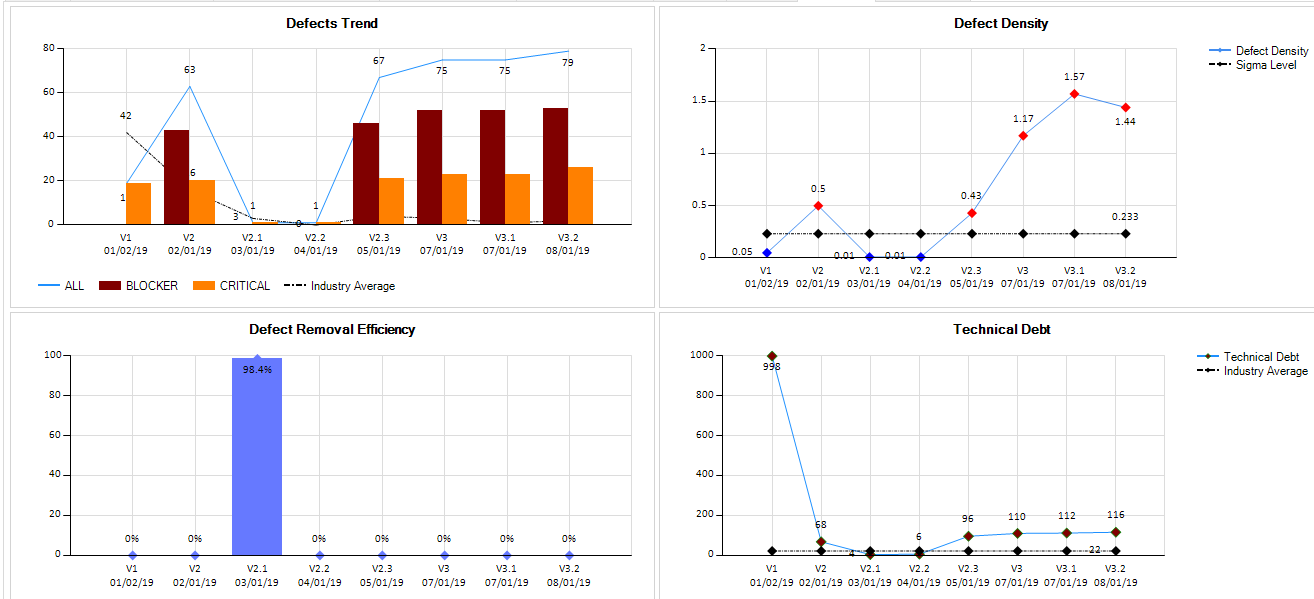
The Defect Density graph shows density respect than the declared Sigma Level (1 to 7).
The Defect Removal Efficiency graph shows related DRE, and you can view in the status bar the total Mean Time To Detect (MTTD)

Technical Debt graph, shows all Technical Debt respect than Industry average.
SUPPORT TO STANDARDS
- ISO/IEC-12207 Software Implementation and Support Processes - COCOMO III Drivers 1 Appendix A
- ISO/IEC-13053-1 DMAIC methodology and ISO 13053-2 Tools and techniques
- ISO/IEC 14143 [six parts] Information Technology—Software Measurement—Functional Size Measurement
- ISO/IEC-18404:2015 - Quantitative methods in process improvement — Six Sigma
- ISO/IEC 19761:2011 Software engineering—COSMIC: A Functional Size Measurement Method
- ISO/IEC 20926:2009 Software and Systems Engineering—Software Measurement—IFPUG Functional Size Measurement Method
- ISO/IEC 20968:2002 Software engineering—Mk II Function Point Analysis—Counting Practices Manual
- ISO/IEC 24570:2018 Software engineering — NESMA functional size measurement method
- ISO/IEC 29881:2010 Information technology - Systems and software engineering - FiSMA 1.1 functional size measurement method
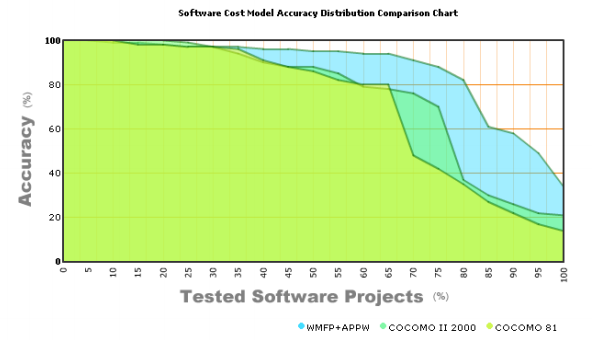
Accuracy
Our solution uses the WMFP© analysis algorithm and the APPW© statistical model at the base of its calculations. As with all statistical models, the larger the dataset the closer it aligns with the statistics, therefore the smaller the source code (or the difference) analyzed the higher the probable deviation. The APPW© model assumes several preconditions essential for enterprise project development:
- The programmers are experienced with the language, platform, development methodologies and tools required for the project.
- Project design and specifications document had been written, or a functional design stage will be separately measured.
The degree of compliance with these preconditions, as well as the accuracy of the required user input settings, affect the level of accuracy of the results. Our software measures development effort done in applying a project design into code (by an average programmer), including debugging, nominal code refactoring and revision, testing, and bug fixing. Note that it measures only development time, It does not measure peripheral effort on learning, researching, designing, documenting, packaging and marketing: creating project design and description documents, research, creating data and resource files, background knowledge, study of system architecture, code optimization for limited speed or size constraints, undocumented major project redesign or revision, GUI design, equipment failures, copied code embedded within original code, fatal design errors.
According to Nguyen, COCOMO II model shows 70% accuracy for 75% of measured projects, as older COCOMO 81 model showed 80% accuracy for 58 to 68% of measured projects according to a study done in the US Air Force Institute Of Technology.
In comparison, WMFP© + APPW© showed 82% Accuracy for %80 of the measured projects, breaking the 80/80 barrier
VALIDATION DATASETS
Quality Reviewer Effort Estimation results, in order to be validated, have been successfully tested with the following public datasets:
| Title/Topic: SiP effort estimation dataset Donor: Derek M. Jones and Stephen Cullum (derek@knosof.co.uk, Stephen.Cullum@sipl.co.uk) Date: June, 24, 2019 Sources: Creators: Knowledge Software, SiP https://github.com/Derek-Jones/SiP_dataset |
| Title/Topic: Software Development Effort Estimation (SDEE) Dataset Donor: Ritu Kapur (kr@iitrpr.ac.in) Date: March 3, 2019 Sources: Creators: IEEE DataPort Ritu Kapur / Balwinder Sodhi 10.21227/d6qp-2n13 |
Title/Topic: Avionics and Software Techport Project Donor: TECHPORT_32947 (hq-techport@mail.nasa.gov) Date: July 19, 2018 Sources: Creators: |
| Title/Topic: Effort Estimation: openeffort Donor: Robles Gregoris (RoblesGregoris@zenodo.org) Date: March 11, 2015 Sources: Creators: Zenodo |
| Title/Topic: Effort Estimation: COSMIC Donor: ISBSG Limited (info@isbsg.org) Date: November 20, 2012 Sources: Creators: Zenodo |
| Title/Topic: China Effort Estimation Dataset Donor: Fang Hon Yun (FangHonYun@zenodo.org) Date: April 25, 2010 Sources: Creators: Zenodo |
| Title/Topic: Effort Estimation: Albrecht (updated) Donor: Li, Yanfu; Keung, Jacky W. (YanfuLi@zenodo.org) Date: April 20, 2010 Sources: Creators: Zenodo |
| Title/Topic: Effort Estimation: Maxwell (updated) Donor: Yanfu Li (YanfuLi@zenodo.org) Date: March 21, 2009 Sources: Creators: Zenodo |
| Title/Topic: CM1/Software defect prediction Donor: Tim Menzies (tim@barmag.net) Date: December 2, 2004 Sources: Creators: NASA, then the NASA Metrics Data Program, http://mdp.ivv.nasa.gov. |
| Title/Topic: JM1/Software defect prediction Donor: Tim Menzies (tim@barmag.net) Date: December 2, 2004 Sources: Creators: NASA, then the NASA Metrics Data Program, http://mdp.ivv.nasa.gov. |
| Title/Topic: KC1/Software defect prediction Donor: Tim Menzies (tim@barmag.net) Date: December 2, 2004 Sources: Creators: NASA, then the NASA Metrics Data Program, http://mdp.ivv.nasa.gov. |
| Title/Topic: KC2/Software defect prediction Donor: Tim Menzies (tim@barmag.net) Date: December 2, 2004 Sources: Creators: NASA, then the NASA Metrics Data Program, http://mdp.ivv.nasa.gov. |
| Title/Topic: PC1/Software defect prediction Donor: Tim Menzies (tim@barmag.net) Date: December 2, 2004 Sources: Creators: NASA, then the NASA Metrics Data Program. http://mdp.ivv.nasa.gov |
| Title/Topic: Cocomo81/Software cost estimation Donor: Tim Menzies (tim@barmag.net) Date: December 2, 2004 Sources: Boehm's 1981 text, transcribed by Srinivasan and Fisher. B. Boehm 1981. Software Engineering Economics, Prentice Hall. Then converted to arff format by Tim Menzies from |
| Title/Topic: Cocomo NASA/Software cost estimation (NASA60) Donor: Tim Menzies (tim@barmag.net) Date: December 2, 2004 Latest Version: 1 Last Update: April 4, 2005 Additional Contibutors: Zhihao Chen (zhihaoch@cse.usc.edu) Sources:Creators: Data from different centers for 60 NASA projects from 1980s and 1990s was collected by Jairus Hihn, JPL, NASA, Manager SQIP Measurement & Benchmarking Element. |
| Title/Topic: Reuse/Predicting successful reuse Donor: Tim Menzies (tim@barmag.net) Date: December 2, 2004 Sources: Creators: NASA, then the NASA Metrics Data Program, http://mdp.ivv.nasa.gov. |
| Title/Topic: DATATRIEVE Transition/Software defect prediction Donor: Guenther Ruhe (ruhe@ucalgary.ca) Date: January 15, 2005 Sources: Creators: DATATRIEVETM project carried out at Digital Engineering Italy |
| Title/Topic: Class-level data for KC1 (Defect Count)/Software defect prediction Donor: A. Günes Koru (gkoru@umbc.edu ) Date: February 21, 2005 Sources: Creators: NASA, then the NASA Metrics Data Program, Additional Informationhttp://mdp.ivv.nasa.gov . Further processed by A. Günes Koru to create the ARFF file. |
| Title/Topic: Class-level data for KC1 (Defective or Not)/Software defect prediction Donor: A. Günes Koru (gkoru@umbc.edu ) Date: February 21, 2005 Sources: Creators: NASA, then the NASA Metrics Data Program, http://mdp.ivv.nasa.gov . Further processed by A. Günes Koru to create the ARFF file. |
| Title/Topic: Class-level data for KC1 (Top 5% Defect Count Ranking or Not)/Software defect prediction Donor: A. Günes Koru (gkoru@umbc.edu ) Date: February 21, 2005 Sources: Creators: NASA, then the NASA Metrics Data Program, http://mdp.ivv.nasa.gov . Further processed by A. Günes Koru to create the ARFF file. |
| Title: Nickle Repository Transaction Data Donor: Bart Massey (bart@cs.pdx.edu) Date: March 31, 2005 Sources: Creators: Bart Massey after analyzing the publicly available CVS archives of the Nickle programming language http://nickle.org . |
| Title: XFree86 Repository Transaction Data Donor: Bart Massey (bart@cs.pdx.edu) Date: March 31, 2005 Sources: Creators: Bart Massey after analyzing the publicly available CVS archives of the XFree86 Project http://xfree86.org . |
| Title: X.org Repository Transaction Data Donor: Bart Massey (bart@cs.pdx.edu) Date: March 31, 2005 Sources: Creators: |
| Title/Topic: MODIS/Requirements Tracing Description File: modis.desc Donor: Jane Hayes (hayes@cs.uky.edu) Date: March 31, 2005 Sources: Creators: Open source MODIS dataset, NASA. Jane Hayes and Alex Dekhtyar modified the original dataset and created an answerset with the help of analysts. |
| Title/Topic: CM1/Requirements Tracing Description File: cm1.desc Donor: Jane Hayes (hayes@cs.uky.edu) Date: March 31, 2005 Sources: Creators: NASA, then the NASA Metrics Data Program, http://mdp.ivv.nasa.gov . Jane Hayes and Alex Dekhtyar modified the original dataset and created an answerset with the help of analysts. |
Title/Topic: Desharnais Software Cost Estimation (DESHARNAIS) Creators: Original data was presented in J. M. Desharnais' Masters Thesis. Martin Shepperd created the ARFF file. |
| Title/Topic: COCOMO NASA 2 / Software cost estimation (NASA93) Donor: Tim Menzies (tim@menzies.us) Date: April 3, 2006 Sources: Creators: Data from different centers for 93 NASA projects between years 1971-1987 was collected by Jairus Hihn, JPL, NASA, Manager SQIP Measurement & Benchmarking Element. |
| Title/Topic: QoS data for numerical computation library Donor: Jia Zhou (jxz023100 AT utdallas DOT edu) Date: September 19, 2006 Sources: Creators: Jia Zhou |
Source: http://promise.site.uottawa.ca/SERepository/datasets-page.html
Further, in order to evaluate some traditional cost models, we used the following additional Datasets:
| Reference | Instances | Attributes |
| Abran and Robillard [-@Abran_TSE96_FP] | 21 | 31 |
| Albrecht-Gaffney [-@AlbrechtG83] | 24 | 7 |
| Bailey and Basili [-@Bailey81] | 18 | 9 |
| Belady and Lehman [-@Belady79] | 33 | |
| Boehm (aka COCOMO Dataset) [-@Boehm81] | 63 | 43 |
| China dataset[^1] | 499 | 18 |
| Desharnais [-@Desharnais88] | 61 | 10 |
| Dolado [-@Dolado97] | 24 | 7 |
| Hastings and Sajeev [-@Hastings01] | 8 | 14 |
| Heiat and Heiat [@Heiat97] | 35 | 4 |
| Jeffery and Stathis [-@Jeffery_ESE96] | 17 | 7 |
| Jorgensen [-@Jorgensen04] | 47 | 4 |
| Jorgensen et al. [-@Jorgensen2003] | 20 | 4 |
| Kemerer [-@Kemerer87] | 15 | 5 |
| Kitchenham (Mermaid 2) [-@Kitchenham2002] | 30 | 5 |
| Kitchenham et al. (CSC) [-@Kitchenham02_CSC] | 145 | 9 |
| Kitchenham and Taylor (ICL) [-@Kitchenham85] | 10 | 6 |
| Kitchenham and Taylor (BT System X) [-@Kitchenham85] | 10 | 3 |
| Kitchenham and Taylor (BT Software Houses) [-@Kitchenham85] | 12 | 6 |
| Li et al.(USP05) [-@LiRAR07][^2] | 202 | 16 |
| Mišić and Tevsić [-@Misic19981] | 6 | 16 |
| Maxwell (Dev Effort) [-@Maxwell02] | 63 | 32 |
| Maxwell (Maintenance Eff) [-@Maxwell02] | 67 | 28 |
| Miyazaki et al. [-@Miyazaki94] | 47 | 9 |
| Moser et al. [-@Moser1999] | 37 | 4 |
| Shepperd and Cartwright [@Shepperd_TSE01] | 39 | 3 |
| Shepperd and Schofield (Telecom 1) [-@Shepperd97_Analogy] | 18 | 5 |
| Schofield (real-time 1) [-@Schofield98PhD,@Shepperd97_Analogy] | 21 | 4 |
| Schofield (Mermaid) [-@Schofield98PhD] | 30 | 18 |
| Schofield (Finnish) [-@Schofield98PhD] | 39 | 30 |
| Schofield (Hughes) [-@Schofield98PhD] | 33 | 14 |
| Woodfield et al. [-@Woodfield81] | 63 | 8 |
Related content
COPYRIGHT (C) 2015-2025 SECURITY REVIEWER SRL. ALL RIGHTS RESERVED.